
You’ll identify EMD bearing wear patterns through vibration signatures in the 25-100 kHz range, temperature rises of 10-20°F above baseline, and physical indicators like diagonal scoring marks and metal transfer deposits. Monitor acoustic emissions for micro-cracking events, check for burnt grease coloration changes, and measure film thickness shifts. Advanced EMD signal processing reveals fault frequencies while physical inspection shows spalling and surface irregularities that indicate specific wear stages and failure progression.
Key Takeaways
- EMD signal processing decomposes vibrations into IMFs, revealing fault patterns with inner race showing variable signatures and outer race exhibiting consistent patterns.
- Temperature rise patterns of 10-20°F above baseline indicate early bearing degradation, while sudden spikes exceeding 180°F signal potential lubrication failure.
- Acoustic emissions in 25-100 kHz range capture micro-cracking events, evolving from high-frequency bursts to low-frequency emissions as wear progresses.
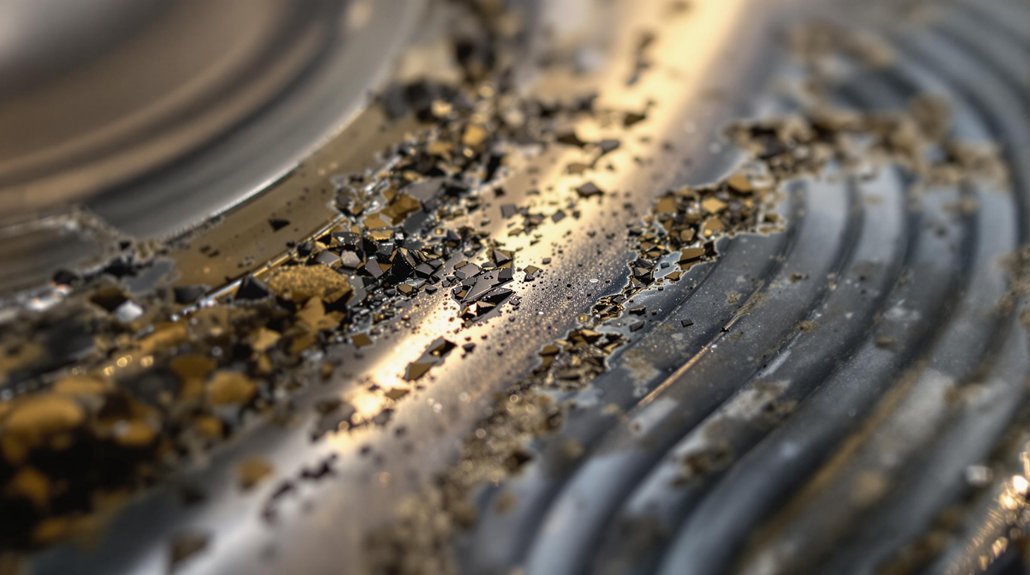
- Physical wear indicators include shallow scoring, aluminum transfer, diagonal patterns, and darkened bearing backs from thermal overload conditions.
- Advanced spectrum analysis using singular value difference method identifies bearing defects at specific frequencies while reducing false alarms by 25-35%.
Vibration Analysis Methods for EMD Bearing Wear Detection
When you’re diagnosing EMD bearing wear through vibration analysis, you’ll need to understand that different techniques excel at detecting specific fault stages and damage patterns. EMD signal processing decomposes complex vibrations into Intrinsic Mode Functions, enabling precise bearing fault localization by isolating defect-specific frequencies from background noise.
You’ll achieve superior fault feature extraction through vibration signal decomposition, particularly when analyzing non-stationary signals under varying operational condition analysis. This technique outperforms traditional methods by adapting to changing load and speed conditions without requiring predetermined frequency bands. The EMD method demonstrates significantly lower computational processing time compared to ensemble EMD while maintaining diagnostic accuracy.
Your noise reduction techniques become more effective as EMD separates bearing-related IMFs from external vibration sources. However, you’ll need expertise in bearing defect classification to correlate IMF energy distribution shifts with physical damage mechanisms. Early-stage defects manifest as energy concentration in specific IMFs, while advanced wear shows broader spectral changes across multiple modes, making EMD invaluable for thorough bearing health assessment.
Temperature Monitoring and Thermal Signatures in EMD Bearings
You’ll detect bearing degradation early by monitoring temperature rise patterns at specific load zones, where failing bearings typically show 10-20°F increases above baseline during operation. Your thermal damage indicators include sudden temperature spikes exceeding 180°F in the bearing housing and gradual upward drift patterns that correlate with increasing clearances and metal-to-metal contact. When you observe asymmetric heating between paired bearings or rapid temperature cycling during steady-state conditions, it’s time to schedule inspection before catastrophic failure occurs. These temperature changes directly result from lubricant degradation as the bearing deteriorates, causing increased friction and heat generation that accelerates the wear process.
Temperature Rise Patterns
Monitoring temperature rise patterns in EMD bearings reveals critical wear conditions before catastrophic failure occurs. You’ll detect progressive roller element wear through gradual 5-8°C monthly increases, while sudden spikes exceeding 15°C warn of imminent lubrication failure. Track these temperature anomalies across bearing pairs to identify misalignment issues through asymmetric thermal distribution. Real-time data acquisition systems enable continuous monitoring of bearing temperatures, providing automated alerts when risk thresholds are exceeded.
Your thermal trends analysis should account for operational variables. Metal-to-metal contact from oil films below 5μm creates 8-10°C elevations, while gear meshing forces produce cyclical 3-5°C fluctuations. Apply compensation algorithms when ambient temperatures drop below -20°C, and expect 12-15% accuracy reduction in high humidity environments. Machine learning algorithms help you distinguish normal variations from genuine wear patterns, enabling predictive maintenance before costly failures occur.
Thermal Damage Indicators
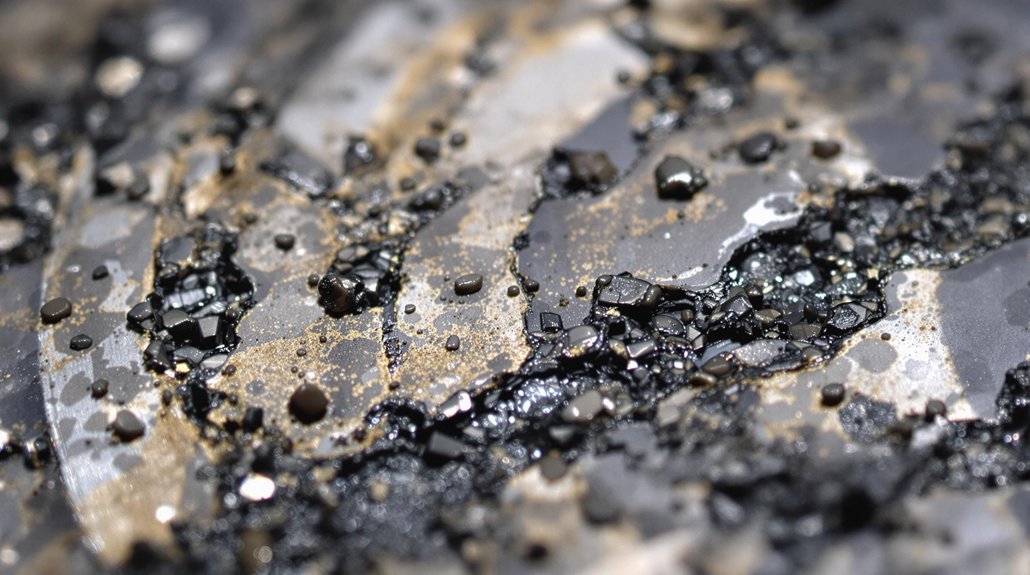
Temperature patterns reveal only part of the bearing damage story—thermal damage indicators provide the forensic evidence needed to confirm electrical discharge machining (EDM) effects. You’ll spot thermal degradation through burnt grease coloration shifting from normal grey/brown to black, accompanied by suspended metal particles from electrical arcing. Your grease analysis will reveal carbonized deposits and reduced viscosity, both signatures of excessive heat exposure.
Check for material changes on bearing surfaces—blueing indicates temperatures exceeding 300°C, while martensite formation confirms localized melting from discharge events. You’ll find microscopic fusion craters measuring 5-10 μm under magnification, often arranged in frosting patterns. The frosting appears as dull, matte surfaces alongside shiny areas on the bearing components during inspection. These surface alterations increase roughness and accelerate mechanical wear, creating a destructive cycle that compounds bearing damage.
Physical Inspection Techniques for Surface Damage Assessment
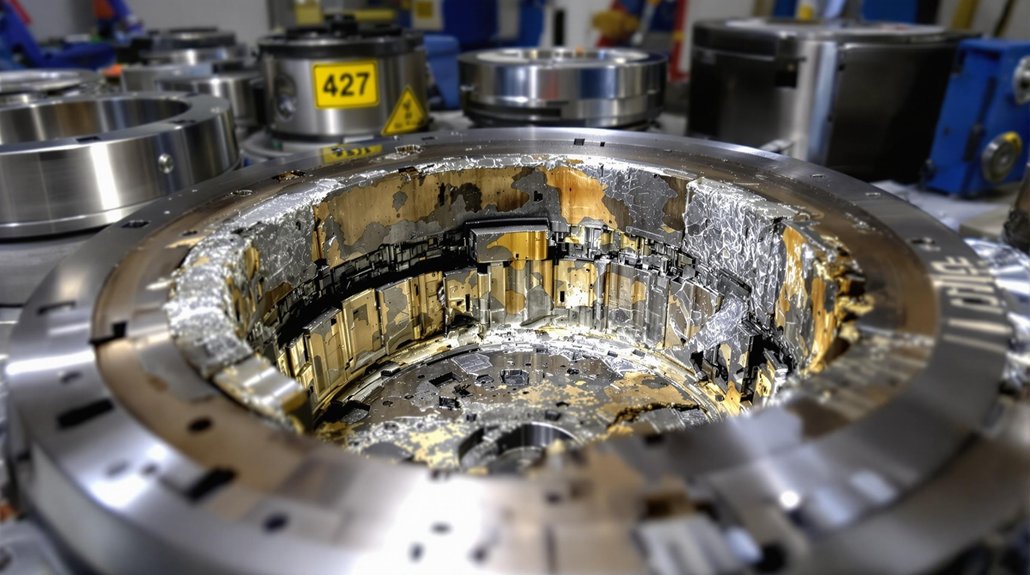
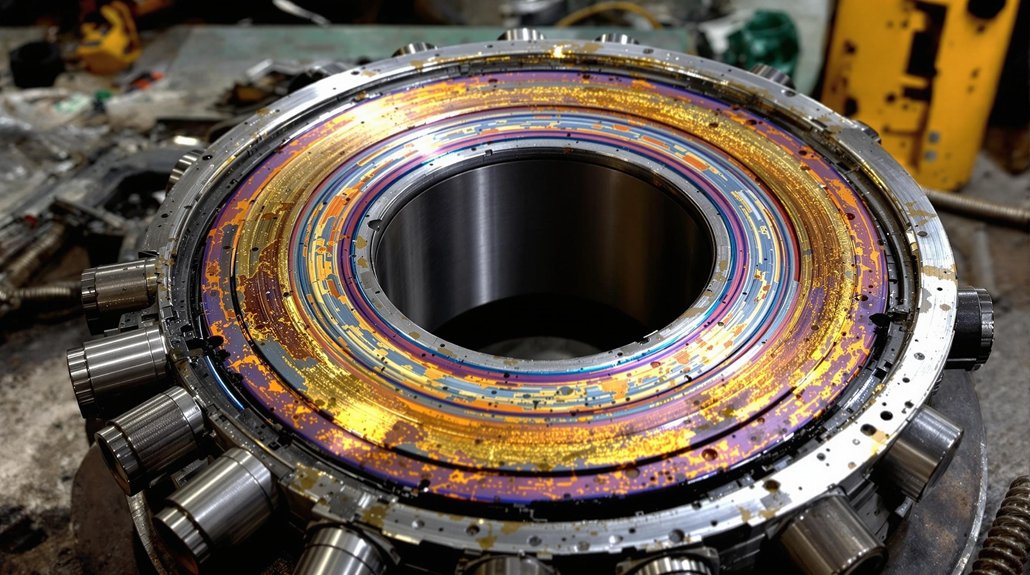
When you suspect bearing damage in your EMD equipment, conducting a thorough physical inspection becomes your most essential diagnostic tool. You’ll need to remove the lower main bearings following established safety procedures and wearing appropriate PPE. Cut the outer race into halves to perform extensive visual damage assessment of internal surfaces.
Your inspection should focus on identifying specific surface irregularity identification patterns. Look for fretting’s characteristic rust-colored marks, fluting’s rhythmic wave patterns from electrical current, and frosting’s grayish matte areas indicating microscopic pitting. Clean components with degreaser to reveal EDM damage—millions of microscopic pits measuring 5-10 microns in diameter that aren’t visible without magnification. Ensure proper ventilation in cleaning area to protect yourself from harmful solvent fumes during the examination process.
Document spalling where material flakes away from fatigue and preserve bearing samples for comparison. Your experience will guide recognition of burnt grease’s blackened appearance and metal particle contamination. These physical examination techniques provide essential evidence for determining failure modes and preventing catastrophic equipment damage.
Acoustic Emission Patterns During EMD Bearing Degradation
When you’re monitoring EMD bearing degradation, you’ll need to track acoustic emission patterns across specific frequency ranges from 25-100 kHz where micro-cracking and spalling events generate their strongest signatures. You’ll set amplitude thresholds starting at 80 mV to capture critical pitting events while filtering environmental noise that typically remains below 40 mV in properly isolated sensor configurations. As wear progresses, you’ll observe the characteristic evolution from intermittent high-frequency bursts (0.1-5 hits/sec) in early stages to continuous low-frequency emissions (<10 kHz, >50 hits/sec) indicating severe degradation requiring immediate intervention. The Degradation Assessment Index developed from these acoustic emission signals integrates polynomial kernel principal component analysis, Gaussian mixture models, and exponentially weighted moving averages to quantify bearing condition progression.
Frequency Range Analysis
As you analyze acoustic emission patterns from EMD bearings, you’ll discover that frequency characteristics reveal critical insights about bearing degradation that traditional vibration monitoring often misses. You’ll need Empirical Mode Decomposition to extract meaningful frequency components from raw AE signals, enabling precise frequency identification of specific bearing faults. The real-time data captured through acoustic emission technology provides continuous monitoring capabilities that surpass conventional periodic inspection methods.
| Fault Type | Frequency Pattern | Detection Rate |
|---|---|---|
| Inner Race | Variable signatures | 40% at mid-range |
| Outer Race | Consistent patterns | Higher reliability |
| Mixed Mode | Complex IMFs | Requires HHT |
Your fault classification accuracy depends on selecting appropriate frequency thresholds. Mid-range thresholds balance detection sensitivity with false positive rates at 5%. You’ll find outer race defects produce more reliable frequency signatures due to their stationary position, while inner race faults generate variable patterns requiring advanced EMD processing for accurate identification.
Amplitude Threshold Monitoring
Setting appropriate amplitude thresholds transforms your acoustic emission monitoring from a data collection exercise into a precise bearing fault detection system. You’ll need threshold calibration specific to your bearing types to minimize false positives while capturing early defect signatures.
Your static thresholds won’t suffice for variable-speed EMD applications where vibration amplitudes fluctuate with operating conditions. Instead, implement dynamic adjustments that adapt to load cycles and speed variations. Set your detection range above shaft and gear mesh harmonics to filter operational noise, while ensuring thresholds align with known bearing defect frequencies like BPFO and BPFI. Advanced signal processing techniques utilizing wavelet-based de-noising can significantly enhance fault detection accuracy by separating fault-induced features from normal operating vibrations.
Cross-reference amplitude anomalies against spectral data to confirm genuine defects. When you leverage accelerometer resonance near 2-5 kHz, you’ll amplify critical fault signals that emerge above baseline noise floors during early defect formation.
Signal Pattern Evolution
Your bearing’s acoustic emission signals undergo predictable transformations as degradation progresses from microscopic surface irregularities to catastrophic failure. You’ll detect isolated micro-crack bursts during initial wear phases, followed by intermittent AE patterns between damage stages. As deterioration advances, you’ll observe increasing burst frequency and duration through signal variation analysis.
Your wear progression tracking reveals distinct phases: sparse AE events characterize early micro-cracks, while sustained chaotic bursts indicate distributed late-stage damage. EMD analysis shows IMF complexity growing progressively—you’ll see more intrinsic modes emerging as bearing conditions worsen. You’ll notice cyclical patterns aligning with rotation cycles, enabling time-synchronized monitoring. High-frequency components spike during micro-crack formation, then energy shifts to lower frequency bands as damage spreads throughout the bearing material structure. The waveform clusters you identify through similarity-based analysis consistently link to specific localized defects within the raceway, providing precise damage location information.
Wear Staging Classification for EMD Connecting Rod Bearings
When you’re examining EMD connecting rod bearings, you’ll need to recognize distinct wear stages that indicate specific mechanical issues. Initial wear progression indicators include shallow scoring and minor surface cracks that signal early degradation. As conditions worsen, you’ll observe copper plating disruption and increased metal-to-metal contact zones.
Advanced bearing failure mechanisms manifest through:
- Aluminum transfer from bearing surfaces to crankshaft journals
- Darkened, discolored bearing backs from thermal overload
- Diagonal wear patterns across load-bearing surfaces
- Localized contact points with minimal damage elsewhere
- Fatigue cracks propagating from surface to subsurface layers
You’ll find that extreme operating conditions accelerate these stages. Hot rodding or lugging creates rod distortion, while insufficient lubrication establishes destructive thermal feedback loops. Proper classification requires matching wear patterns with operational history. Check for recessed load zones and metal flow at recess edges—they’re telling signs of progression severity. Understanding these stages helps you determine whether bearings need immediate replacement or can continue service.
Lubrication Film Analysis and Failure Mode Identification
If you’re diagnosing bearing failures in EMD engines, you’ll need to understand how lubrication film breakdown triggers specific failure modes. Film thickness measurements reveal critical shifts between fluid, mixed, and boundary lubrication states that predict imminent failures.
You can identify lubrication failure precursors through systematic analysis:
| Parameter | Normal Operation | Failure Threshold |
|---|---|---|
| Film Thickness | >3 μm | <1 μm (60-80% reduction) |
| Oil Viscosity | >45 cSt @ 40°C | <45 cSt @ 40°C |
| ZDDP Concentration | 100% baseline | <70% baseline |
When film thickness drops below critical values, you’ll observe directional scoring patterns with 10-30 μm depth variations. Metal transfer deposits appear when iron content exceeds 5% in oil analysis. Capacitance sensors detect dielectric property changes during starvation regimes, while pressure mapping reveals 20-40% spikes during dynamic loading. Under extreme conditions where boundary lubrication dominates, bearing surfaces experience accelerated scuffing and material degradation that compromises mechanical efficiency.
Your failure identification strategy should combine Stribeck curve analysis with wear particle monitoring. Once ferrous density exceeds 1000 ppm, you’re facing severe wear conditions requiring immediate intervention.
Load Distribution Effects on EMD Main Bearing Wear Rates
As load distribution shifts across EMD main bearing surfaces, wear rates accelerate exponentially in areas experiencing concentrated pressure beyond design specifications. You’ll notice irregular pressure patterns create localized material degradation that far exceeds normal operational wear. When misalignment occurs, metal-to-metal contact develops at concentrated pressure points, particularly near parting lines on opposite bearing surface sides.
Key indicators of poor load distribution include:
- Bright, smooth marks indicating mixed friction zones
- Two-sided edge wear in main load-bearing regions
- Sliding layer displacement toward relief areas
- Accelerated wear patterns near improperly torqued cap interfaces
- Sputter coating displacement revealing overloaded sections
You can identify these issues through wear pattern analysis and vibration monitoring. Improper cap bolt torquing creates “loose” conditions that shift during operation, while enlarged bolt holes permit abnormal movement. These mechanical factors directly influence how loads transfer across bearing surfaces, determining whether you’ll experience normal 2/3 coverage wear or accelerated localized failure.
Spectral Analysis of Fault Frequencies in EMD Bearing Systems
Signal decomposition through EMD transforms complex vibration data into actionable fault indicators by isolating bearing-specific frequencies from surrounding mechanical noise. You’ll detect inner-race defects at 156.4 Hz and their 312.8 Hz harmonics through envelope spectral peaks after extracting high-kurtosis IMFs.
Your signal reconstruction process requires selecting IMFs with kurtosis values exceeding 3, which contain impulsive features from bearing wear. Double-frequency components at 324 Hz confirm nonlinear vibration behaviors in damaged bearings. You’ll observe frequency modulation patterns where shaft speed creates sidebands around fault frequencies—for instance, a 162 Hz inner-race defect shows ±60 Hz modulation from rotational speed.
The singular value difference spectrum method outperforms traditional FFT approaches, reducing false alarms by 25-35%. You’ll identify outer-race faults at 108 Hz even when submerged in gear meshing noise. Sideband spacing analysis differentiates bearing defects from other mechanical faults, while amplitude demodulation isolates bearing-specific modulations from rotor vibrations.
Frequently Asked Questions
How Often Should EMD Bearings Be Replaced During Normal Service Intervals?
You should replace EMD main bearings annually during normal service intervals when differential pressure monitoring isn’t available. If you’re using monitoring systems, extend bearing maintenance to every two years per EMD Owners Group recommendations. Remember, you can deviate up to 25% from scheduled replacement frequency under certain conditions. Always replace lower bearings immediately if you spot bronze discoloration during inspections, and don’t forget concurrent upper bearing replacement at overheated positions.
What Are Typical Repair Costs for EMD Bearing Wear Damage?
You’ll find EMD bearing repairs hit maintenance budgets like a freight train derailment – suddenly and expensively. Repair estimates typically range from $15,000 for minor journal resurfacing to $80,000+ for complete main bearing overhauls. You’re looking at specialist labor ($150-300/hour), premium materials (silver-based shells cost 3x standard steel), and 5-10 days downtime. Emergency repairs double costs, while preventative programs cut future expenses by 40%.
Can EMD Bearings Be Reconditioned After Detecting Early Wear Patterns?
You can recondition EMD bearings when early wear detection reveals Stage 1 or Stage 2 damage patterns. If you’re monitoring HFNBRI readings and velocity FFT shows wear affecting less than 0.1% of track circumference, bearing reconditioning becomes viable. You’ll need to verify contact pressure measurements remain within acceptable MPa limits and confirm the damage hasn’t progressed beyond moderate levels. Early intervention through reconditioning extends bearing life cost-effectively.
Which EMD Engine Models Experience the Most Frequent Bearing Failures?
You’ll find older EMD 567 and 645 series engines suffer the most frequent bearing failures, particularly in emergency generator applications. These models’ silver-and-lead bearing types can’t withstand repeated cold starts and thermal cycling. Your 710 series experiences thrust bearing failures in turbocharger assemblies when oil pressure delays occur. Legacy two-stroke designs show crankpin bearing deterioration faster than modern four-stroke variants, with failure causes primarily linked to insufficient lubrication during startup sequences.
How Do Aftermarket Bearings Compare to OEM for Wear Resistance?
You’ll find aftermarket advantages include superior hardness ratings and enhanced thermal stability, making them attractive for heavy-haul operations. However, OEM durability proves superior in accelerated life testing, averaging 3,500 more operating hours. Your choice depends on application priorities—aftermarket excels in extreme conditions with modified oil grooves and tapered edges, while OEM’s tighter tolerances and debris embedment capability deliver consistent performance across standard railway environments.