

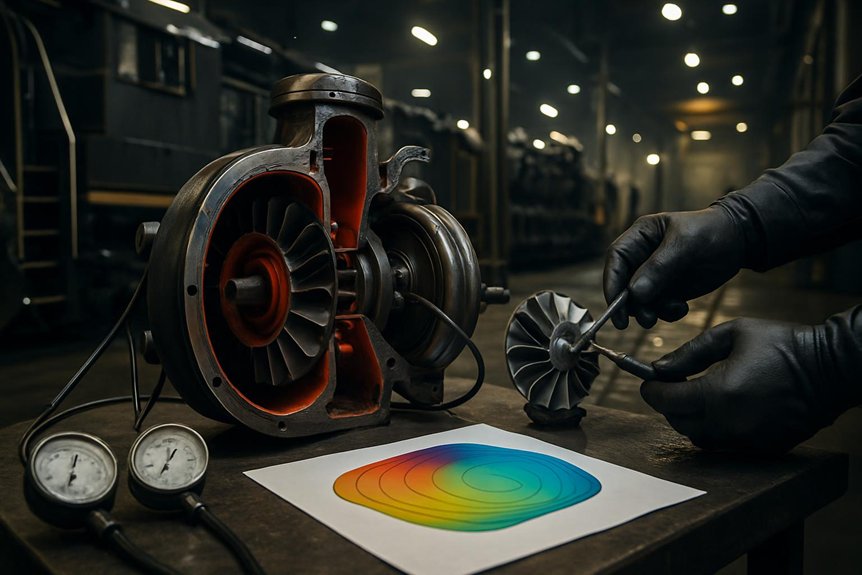
You use EMD 710 compressor and turbine maps to track corrected airflow, pressure ratio, shaft speed, surge margin, exhaust energy, backpressure, and temperature across real notch cycles. The compressor map shows whether boost stays stable during idle recovery, switching, notch-up, and full load. The turbine map shows whether exhaust flow drives boost efficiently without excess heat or scavenging restriction. Together, they (EMD 710 Turbocharger Maps) predict smoke, fuel burn, thermal stress, response lag, reliability, and lifecycle cost across each duty-cycle condition ahead.
How do turbine and compressor maps for the EMD 710 turbocharger influence locomotive duty-cycle performance?
The turbine and compressor maps of the EMD 710 turbocharger determine how effectively the engine breathes across idle, notch changes, and sustained load. In locomotive service, they shape boost, exhaust energy recovery, and transient response, which directly affect tractive effort, fuel use, smoke, and thermal limits.
For rail engineers, the key is matching the turbocharger operating point to the locomotive duty cycle. A compressor map shows where the turbo can deliver stable airflow without surge or excessive discharge temperature. A turbine map shows whether exhaust energy can drive the compressor efficiently at low and high engine loads. Together, they define how well the EMD 710 responds during acceleration, switching, and long-haul running.
For procurement specialists, these maps matter because they influence reliability, maintenance intervals, and life-cycle cost. A poorly matched turbocharger can increase overfueling, lag, fouling, and heat stress in locomotive service. A well-matched unit supports cleaner combustion, better fuel economy, and more consistent performance across changing grades and ambient conditions.
Key Takeaways
- EMD 710 turbocharger maps verify airflow, pressure ratio, and surge margin across idle, notch changes, and full-load operation.
- Compressor maps show whether boost and air mass flow remain stable during low-flow events, switching, and rapid throttle commands.
- Turbine maps reveal how exhaust energy, backpressure, and efficiency affect scavenging, smoke control, and thermal loading.
- Poor turbine-compressor matching causes boost lag, rich running, higher exhaust temperatures, fuel penalty, and uneven tractive effort.
- Map-based duty-cycle analysis supports procurement, maintenance intervals, cleaning schedules, reliability planning, and total lifecycle cost control.
EMD 710 Turbocharging in Locomotives
You use EMD 710 turbocharger maps to verify airflow, pressure ratio, and surge margin across each locomotive notch. As load changes, you’re asking the turbocharger to match boost demand faster than steady-state test data suggests. Rail duty cycles stress the match harder because grades, throttle transitions, and thermal limits shift engine breathing continuously.
EMD 710 turbocharger maps and engine breathing
The EMD 710’s two-stroke cycle depends on controlled scavenging air at every locomotive load band. You use emd 710 turbocharger maps to verify that airflow supports cylinder clearing, charge density, and combustion stability. Because the engine fires every revolution, weak boost quickly raises smoke, exhaust temperature, and fuel penalty.
| Load band | Airflow need | Map concern |
|---|---|---|
| Idle/low load | Stable scavenging | Surge margin |
| Mid load | Clean combustion | Pressure ratio |
| High load | Thermal control | Compressor flow |
You should read each operating point against compressor flow and turbine energy lines. That comparison shows whether the turbocharger can move enough air without overspeed, surge, or high discharge temperature. In locomotive service, this breathing margin protects liners, valves, and aftercooler performance under sustained duty.
Locomotive notch changes and boost demand
After confirming engine breathing margins, notch response shows how quickly the EMD 710 converts fuel demand into stable boost. You see this during rapid throttle changes, when rack position increases before airflow fully catches up. Exhaust energy rises, turbine speed accelerates, and compressor flow must move rightward without crossing unstable regions.
You evaluate EMD 710 turbocharger maps by tracking pressure ratio, corrected flow, and speed during each notch step. A strong match preserves compressor surge margin while building boost fast enough to limit smoke and exhaust temperature. If the turbine efficiency map shows weak energy conversion at that point, boost lags and combustion runs rich. That lag affects tractive effort, fuel rate, and thermal loading. For procurement, you need map evidence that the turbocharger handles notch transients, not just rated load.
Why rail duty cycles are harder than steady-state testing
While steady-state tests hold speed and load nearly constant, rail service forces the EMD 710 through sharper operating changes. You see this when switching demands rapid notch cycling, climbing sustains high exhaust energy, and cruising holds moderate airflow for hours. Bench data can miss these transitions because it averages boost, temperature, and shaft-speed behavior.
In service, you’re managing moving operating points across compressor and turbine maps. A turbine efficiency map helps you judge whether exhaust energy supports boost during acceleration without excess backpressure at load. If matching is weak, you’ll see slower notch response, higher smoke, hotter components, and reduced locomotive duty cycle performance. That’s why EMD 710 turbocharger maps must be reviewed against real routes, tonnage, grades, ambient conditions, and maintenance condition, not only rated-point test results.
Compressor Map and Locomotive Airflow
You use the compressor map to verify stable airflow across idle, notch changes, and full-load EMD 710 operation. You’ll protect compressor surge margin by checking low-speed response against required boost and air mass flow. You also track discharge temperature because hotter air reduces combustion quality, raises smoke risk, and stresses engine components.
Compressor operating range in locomotive service
Because locomotive loading changes constantly, the compressor map must show a stable airflow zone across idle, notch changeovers, and full-load operation. You use this zone to verify that airflow, pressure ratio, and compressor speed remain aligned with the EMD 710 engine’s fuel demand. That alignment protects locomotive duty cycle performance by supporting clean combustion during switching, climbing, and sustained haul service.
You should read the operating range as a practical envelope, not a laboratory curve. Each point shows whether the turbocharger can supply enough mass flow without pushing discharge temperature or shaft speed beyond acceptable limits. In railroad service, ambient temperature, altitude, filter restriction, and worn components shift those points. Map review helps you predict boost consistency, thermal loading, and maintenance exposure before sourcing or approving replacement hardware.
Surge margin and low-speed response
After defining the compressor operating envelope, surge margin shows how safely the turbocharger handles low-flow locomotive events. In EMD 710 turbocharger maps, you track this margin between the operating line and surge boundary.
During idle recovery, switching, or notch-up commands, airflow can drop while pressure ratio rises. If matching is poor, you push the compressor toward unstable flow. Surge then creates pulsation, boost fluctuation, and slower cylinder air delivery. That response can delay load pickup and stress bearings, seals, and blades.
You should compare expected duty-cycle points against the compressor surge margin, not just rated-load airflow. A wider margin improves low-speed response during transient rail service. However, excessive margin without efficiency can sacrifice useful boost. Mikura International helps you evaluate map data against actual locomotive duty cycle performance.
Discharge temperature and combustion quality
How does compressor efficiency translate into cleaner combustion on an EMD 710 locomotive? You read EMD 710 turbocharger maps to see where airflow stays efficient, dense, and stable under load.
Higher compressor efficiency reduces discharge temperature for a given pressure ratio. Cooler charge air increases oxygen density entering the cylinders. That helps you match injected fuel with available air during notch changes and sustained pulls.
When discharge temperature rises, air density falls and combustion margin tightens. You’ll see more smoke risk, higher exhaust temperature, and slower recovery after load shifts. Fouling or poor map matching pushes the operating point toward hotter regions.
Use compressor map data to compare airflow, pressure ratio, and efficiency islands against your locomotive duty cycle performance. Better alignment supports smoke control, fuel economy, and predictable thermal loading.
Turbine Map and Exhaust Energy Recovery
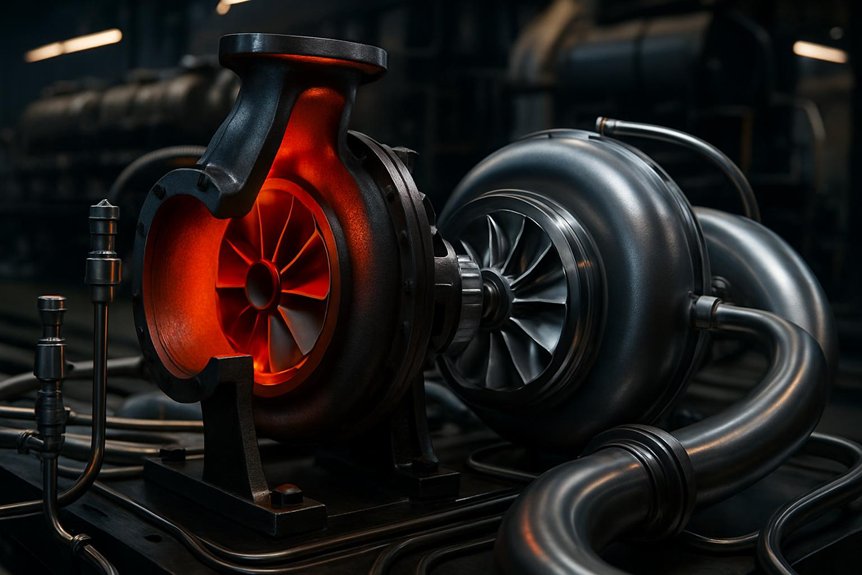
You use the turbine efficiency map to track how changing exhaust flow drives boost across each locomotive notch. In two-stroke EMD 710 service, you can’t ignore backpressure because it affects scavenging, cylinder clearing, and smoke control. At high load, you need efficient exhaust energy recovery to limit thermal stress and protect duty-cycle reliability.
Turbine map behavior under changing exhaust flow
As exhaust mass flow and temperature rise across the locomotive load range, the turbine map shows how effectively the turbocharger converts that energy into compressor drive. You use EMD 710 turbocharger maps to verify speed, flow, and efficiency alignment during duty changes.
| Duty point | Exhaust energy | Turbine response |
|---|---|---|
| Idle | Low flow, low heat | Limited drive, low boost |
| Notch-up | Rising pulse energy | Accelerates rotor quickly |
| Transitory | Unsteady flow | Tracks stable efficiency island |
| Full load | High flow, high heat | Delivers rated compressor power |
At idle, you expect modest recovery, not high boost. During notch transitions, you need rapid energy capture without overspeed. At full load, the turbine efficiency map confirms sustained power conversion, supporting locomotive duty cycle performance.
Backpressure and scavenging in two-stroke locomotives
Turbine efficiency also affects exhaust backpressure, which directly shapes scavenging in two-stroke EMD 710 locomotives. You need enough pressure drop across the cylinders to clear residual gas before fresh charge enters. If the turbine map restricts flow, backpressure rises, trapped exhaust increases, and oxygen availability falls. That reduces combustion quality during notch changes and sustained pulling.
You evaluate EMD 710 turbocharger maps to confirm the turbine can pass exhaust mass flow without upsetting air balance. Lower restriction supports cleaner cylinder clearing, steadier blower-assisted airflow, and stronger compressor work. Excessive backpressure can also distort port scavenging, raising smoke risk and fuel penalty. When turbine matching aligns with the duty cycle, you protect locomotive duty cycle performance through stable breathing, consistent boost, and measured exhaust energy recovery across operating notches.
High-load efficiency and thermal stress control
Control high-load heat by reading the turbine efficiency map against exhaust mass flow and pressure ratio. You can see where exhaust energy converts into shaft power without excessive backpressure. In EMD 710 turbocharger maps, that high-efficiency island matters during notch 8, long grades, and hot ambient operation.
Efficient turbine operation lowers exhaust manifold temperature, turbine inlet temperature, and cylinder thermal loading. It also helps the compressor maintain target boost with less waste energy. When the operating point moves outside the efficient zone, you’ll see higher heat rejection, slower boost recovery, and greater stress on blades, bearings, seals, and aftercoolers. That stress shortens overhaul intervals.
Use measured exhaust temperature, boost, and fuel rate to validate map matching. Data helps you protect reliability while sustaining locomotive duty cycle performance under maximum load.
Duty-Cycle Effects on Performance
You see locomotive duty cycle performance change as acceleration, switching, and haulage move the turbocharger across its maps. and track fuel rate, boost, and smoke response to confirm the EMD 710 turbocharger maps match real notch demand. You reduce reliability risk when compressor surge margin and turbine efficiency map data reflect actual railroad conditions.
Acceleration, switching, and haulage scenarios
When a locomotive moves from idle to higher notches, the turbocharger must build boost before fueling exceeds available air. You read EMD 710 turbocharger maps to predict that delay. In switching, short bursts push operating points rapidly across the compressor map. Weak compressor surge margin can make crews feel hesitation, vibration, or uneven loading.
| Scenario | Operational feeling |
|---|---|
| Yard switching | Tense, repeated boost recovery |
| Notch acceleration | Urgent airflow demand |
| Grade entry | Heavy thermal rise |
| Sustained haulage | Steady, confident pull |
During long sustained pulls, you hold the turbo near a stable island on the turbine efficiency map. Exhaust energy stays consistent, so boost stabilizes and cylinder balance improves. Compare both cases before approval: transient duty exposes response limits, while haulage reveals endurance limits.
Fuel economy and smoke response
After response and endurance limits, fuel burn and smoke show whether the air path truly matches the duty cycle. With EMD 710 turbocharger maps, you compare commanded fuel, boost pressure, airflow, and exhaust temperature at each notch.
Better map matching keeps the compressor operating in efficient islands, so you get denser charge air without excess discharge heat. That improves air-fuel ratio control during acceleration, switching, and sustained haulage. When airflow arrives late, fuel burns rich, cylinders see incomplete combustion, and visible exhaust rises. When the turbine efficiency map matches exhaust energy, you recover more drive power for boost instead of wasting heat. You’ll see lower specific fuel consumption, cleaner stack opacity, and steadier locomotive duty cycle performance across grades, ambient changes, and throttle transitions while preserving available tractive effort.
Reliability under real railroad conditions
Often, real railroad reliability depends on how well the map fit handles contaminated air, heat, and rapid notch changes. You see this in EMD 710 turbocharger maps when operating points stay away from surge and overspeed limits.
- Fouling: You reduce efficiency loss when compressor flow capacity tolerates dirty filters and airborne dust.
- Heat: You protect pistons, valves, and aftercoolers when the turbine efficiency map controls exhaust temperature.
- Bearings: You lower thrust load when pressure ratio changes smoothly during notch shifts, not abruptly.
- Service life: You extend overhaul intervals when boost, shaft speed, and exhaust energy align with the locomotive duty cycle performance profile.
You can’t remove railroad variability. You can specify map-matched turbochargers that absorb it with stronger compressor surge margin and lower mechanical stress.
Selection and Procurement Considerations
You should match EMD 710 turbocharger maps to each locomotive mission profile, including switching, grade haul, and sustained notch operation. You’ll need to verify compressor surge margin, turbine efficiency map data, material specifications, and test records before approval. This approach links procurement decisions to maintenance planning, reliability targets, and measurable life-cycle value.
Matching turbo maps to locomotive mission profiles
Match EMD 710 turbocharger maps to the locomotive’s actual mission profile before approving a replacement unit. You’ll reduce mismatch risk when map data reflects real throttle time, load factor, altitude, and ambient temperature.
- For yard duty, prioritize compressor surge margin at low airflow and rapid notch changes.
- For regional service, balance transient boost response with mid-load fuel efficiency.
- For mainline haulage, emphasize stable high-load operation on the turbine efficiency map.
- For mixed fleets, compare operating points against recorded duty-cycle histograms before selection.
This approach helps you predict locomotive duty cycle performance with fewer assumptions. You can identify where boost lag, overfueling, exhaust temperature, or fouling may appear. Mikura International supports sourcing decisions with practical application review, not guesswork, for demanding EMD 710 locomotive service conditions.
Specification checks for buyers and engineers
Before approving an EMD 710 replacement turbocharger, procurement teams should request map-based performance data, not only part numbers. You should ask for EMD 710 turbocharger maps showing corrected airflow, pressure ratio, shaft speed, and efficiency islands across expected locomotive notches.
Review compressor surge margin at low-load shifts and high-altitude operation. Check turbine efficiency map data against exhaust temperature, mass flow, and backpressure limits. Require evidence of boost response during notch changes, including acceleration time and smoke-related airflow shortfall. Compare heat rejection, overspeed margin, and discharge temperature with your engine limits. Ask Mikura International for dimensional checks, material specifications, balancing records, and test-stand results. Document acceptable tolerances before purchase, so you can verify performance, not assume interchangeability across demanding rail duty cycles.
Maintenance planning and life-cycle value
When maintenance teams use map data during selection, they can forecast wear risk before it becomes downtime. You use EMD 710 turbocharger maps to link operating points with heat, speed, surge exposure, and fouling sensitivity across locomotive duty cycles.
- Compare compressor surge margin against notch transitions, not only rated load.
- Check the turbine efficiency map for exhaust energy use during sustained grades.
- Track predicted discharge temperature to plan cleaning, inspection, and bearing intervals.
- Align replacement specifications with fleet routes, ambient conditions, and load factors.
This approach helps you reduce unplanned removals, smoke events, and fuel penalties. It also supports stronger budget control because you’re buying expected service life, not just hardware. Mikura International helps you evaluate map fit, failure risk, and total ownership cost before procurement.
Frequently Asked Questions
How Does Altitude Affect EMD 710 Turbocharger Map Matching?
Altitude lowers air density, so you push the compressor operating point toward higher pressure ratio and reduced mass flow. That can shrink compressor surge margin, raise discharge temperature, and slow notch response. You’ll also see changed turbine drive because exhaust energy must work harder to maintain boost. When you evaluate EMD 710 turbocharger maps, compare expected route altitude, ambient temperature, load profile, and allowable thermal limits before you source or approve replacements.
Can Fouled Aftercoolers Shift Compressor Operating Points?
Yes, fouled aftercoolers can shift compressor operating points. You’ll see higher charge-air temperature, greater pressure drop, and reduced air density. That forces the EMD 710 turbocharger to work farther right on its compressor map for the same cylinder air demand. You can lose compressor surge margin, raise exhaust temperature, and increase smoke during notch changes. You should inspect pressure differential, outlet temperature, and fouling trends before blaming turbocharger performance alone.
How Often Should Turbocharger Performance Data Be Reviewed?
Like reading smoke signals from the stack, you should review turbocharger performance data monthly, and after major load complaints, overhauls, or aftercooler cleaning. Track boost pressure, exhaust temperature, airbox pressure, turbo speed, and fuel rate by notch. You’ll catch drift before it becomes surge, overfueling, or bearing distress. For EMD 710 turbocharger maps, compare field points against expected compressor surge margin and turbine efficiency trends during scheduled reliability reviews.
Do Seasonal Temperatures Change Surge Risk in Locomotives?
Yes, seasonal temperatures change surge risk in locomotives. You see higher risk in cold dense air if fueling and boost control don’t stay matched. Hot weather can reduce air density, raise exhaust temperatures, and narrow operating margins under load. You should compare EMD 710 turbocharger maps against ambient data, notch profile, and compressor surge margin. That helps you predict unstable airflow, smoke, and thermal stress before reliability suffers.
Can Map Data Help Predict Turbocharger Overhaul Timing?
Yes, you can use map data to flag overhaul timing trends. You compare actual boost, exhaust temperature, shaft speed, and airflow against EMD 710 turbocharger maps. If operating points drift toward lower compressor efficiency, reduced surge margin, or poorer turbine efficiency, you’re seeing fouling, erosion, leakage, or bearing wear. That evidence helps you plan overhaul before smoke, fuel penalty, high thermal stress, or unscheduled locomotive downtime appears.