EMD 9518890 Axial Fan – How Does Ambient Air Pressure Affect the Operational Performance and Efficiency?

EMD 9518890 Axial Fan – How Does Ambient Air Pressure Affect the Operational Performance and Efficiency?

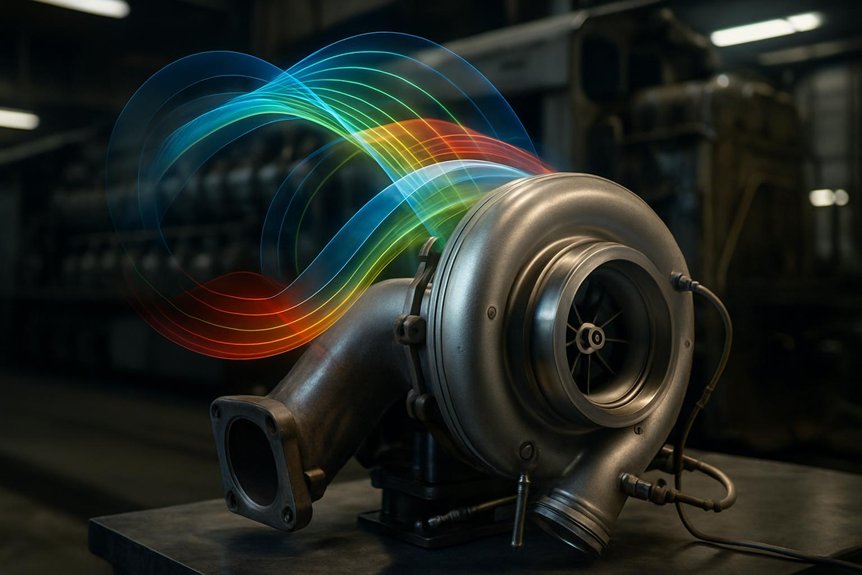
When ambient static pressure drops, the EMD 9518890 axial fan ingests lower-density air. The inlet operating point shifts on the fan pressure–flow map. Static pressure capability drops, and cooling airflow reduces.

Efficiency also typically declines. Incidence losses and wake losses rise as density falls. Shaft power often increases to hold radiator ΔT. Convective heat transfer weakens too. Thermal and stall margins tighten. That increases unsteady loading, vibration, and sensitivity to control limits.

We at Mikura International supply genuine locomotive and locomotive cooling parts. We also support marine engine spares where applicable. We are an importer, exporter, and supplier, not the OEM.

Common pain point

Locomotive operators often face reduced cooling performance in low-pressure weather. This can lead to higher engine temperatures and airflow instability. Many teams then see efficiency losses and vibration concerns. Spare availability also becomes critical during peak demand periods.

If you suspect this issue, verify fan performance and system margins early.

What changes when ambient pressure drops

  • Lower-density inlet air reduces mass flow potential.
  • Fan operating point shifts on the pressure–flow curve.
  • Achievable static pressure decreases at the inlet.
  • Cooling airflow drops, especially at high heat load.
  • Incidence and wake losses typically increase.
  • Required shaft power increases to maintain radiator ΔT.
  • Convective heat transfer coefficient declines.
  • Stall margin becomes more sensitive to flow disturbances.
  • Unsteady loading risk increases, raising vibration concerns.

Quick reference data (directional guidance)

Ambient conditionAir density trendFan airflow trendStatic pressure trendEfficiency trendThermal margin
Higher ambient pressureHigher densityBetterHigherBetterWider
Normal ambient pressureNominal densityNominalNominalNominalNominal
Lower ambient pressureLower densityReducedReducedLowerNarrower

Typical operational impacts in locomotive cooling

System goalEffect of lower ambient pressurePractical implication
Maintain radiator ΔTMore power needed for same coolingHigher fan load demand
Maintain coolant temperatureHeat transfer weakensReduced thermal margin
Avoid flow instabilityStall margin tightensHigher vibration sensitivity

How to respond with correct spares and support

  • Inspect fan components for wear and imbalance.
  • Check inlet ducting and filter restrictions.
  • Validate fan speed and drive integrity.
  • Confirm radiator health and air-side cleanliness.
  • Plan replacement of high-wear fan parts proactively.

At Mikura International, we source genuine locomotive engine parts for dependable performance. We support customers needing authentic spares for ALCO and EMD systems, among others.

Key Takeaways

  • Ambient pressure sets the fan inlet static pressure, shifting the operating point on the speed–pressure/flow performance map.
  • Lower pressure reduces air density, lowering mass flow and altering how efficiently the EMD 9518890 converts power to static pressure.
  • Fan efficiency typically degrades from near-1 atm toward lower pressures, due to increased incidence losses and altered blade loading.
  • Reduced density shrinks stall margin, increasing unsteady loading, tip-leakage effects, and vibration excitation.
  • Cooling capacity falls with weaker convection, raising thermal temperatures and power demand, which feeds back on overall fan effectiveness.

Introduction to Atmospheric Pressure and Air Density

altitude affects air density

You start by defining ambient pressure as the local static pressure your axial fan “sees,” and you note it drops predictably with altitude while conditions vary. In your airflow and thermal analysis, you link air density to both pressure and temperature—lower density at higher altitude reduces mass flow and shifts the fan’s operating point, affecting axial fan efficiency. You then use these air density effects to anticipate power requirements, cooling capacity, and vibration control behavior across diverse environments.

Definition of ambient pressure and its variation with altitude

  • Specify reference pressure for CFD/AMR boundary conditions
  • Track inlet static pressure versus elevation
  • Adjust modeled pressure-loss coefficients accordingly
  • Validate fan operating points for High Altitude Operation

In turn, you preserve Axial Fan Efficiency predictions and avoid instability near lift-off conditions.

How air density changes with pressure and temperature

Ambient air pressure and temperature jointly set the air density, and that density controls mass flow through the EMD 9518890 axial fan. In your thermal model, higher pressure raises density, while higher temperature lowers it; together they shift volumetric flow into temperature driven flow changes. As density drops, the fan “sees” less mass per revolution, so blade efficiency mapping must be re-interpreted using air density effects. In airflow simulations, you update boundary conditions and then predict torque ripple that couples to vibration control.

ConditionDensity trendModeling impact
+Pressurehigher mass flow
+Temperaturereduced mass flow
Cool +High P↑↑peak axial efficiency
Warm +Low P↓↓efficiency loss

These Ambient Pressure Fan Performance shifts match axial fan efficiency and high altitude operation.

Relevance of these factors to fan operation in diverse environments

How you model an EMD 9518890 axial fan in the field depends on atmospheric pressure and air density because they set the inlet mass flow and the aerodynamic loading on the blades. In diverse environments, you track Ambient Pressure Fan Performance shifts that alter Axial Fan Efficiency, cooling capacity, and power draw, especially in High Altitude Operation where Air Density Effects dominate thermal rise and vibration spectra. For reliable CFD Validation and control, you confirm:

  • inlet density vs. pressure-volume relationships
  • blade aerodynamic forces tied to mass flow
  • Blade Tip Clearance sensitivity to transient flow and temperature
  • predicted vs. measured temperatures and acoustic/shaft vibration

Then you update operating maps so the locomotive cooling loop stays stable across mountain passes, reducing surge risk and keeping efficiency near design.

Impact on Fan Performance Curves

static pressure curve shifts

When you reduce ambient pressure, the air density drops, thus the axial fan’s achievable static pressure falls and the operating point drifts on the performance curve. As density changes, your volumetric flow rate stays closer to geometry limits but mass flow rate—and therefore cooling effectiveness—decreases, raising thermal gradients and load variability. Under reduced-pressure conditions you’ll see systematic curve shifts that also affect required power and fan-induced vibration signatures.

Direct correlation between air density and fan static pressure

Because air density sets the boundary conditions for the flow field, it directly shifts the relationship between the fan’s developed static pressure and its operating point on the fan performance curves. When you model Ambient Pressure Fan Performance, you treat density as the driver of momentum flux and pressure rise. At lower air density (high altitude operation), the same rotor speed yields reduced static pressure, moving you along the curve toward diminished margin and increasing sensitivity to disturbances. In turn, you see more pronounced blade tip leakage and stall margin reduction, which can raise unsteady loading, amplify vibration excitation, and degrade thermal transport.

  • Momentum flux scales with density
  • Static pressure rise shifts on the curve
  • Leakage worsens near tips
  • Stall margin shrink increases instability risk

Effect on volumetric flow rate and mass flow rate

Lower ambient pressure doesn’t just reduce the fan’s static pressure capability—it also reshapes where the operating point lands on the fan curves by changing the air properties that govern throughput. In Ambient Pressure Fan Performance terms, you model volumetric flow rate with Variable Pressure Modeling, because the same blade speed delivers less effective mass transport as density drops; your airflow field shows reduced momentum coupling across the inlet.

Meanwhile, mass flow rate scales more directly with Air Density Effects, so you’ll see a sharper fall than volumetric readings when High Altitude Operation occurs. That reduced mass flow weakens convective heat removal, nudging temperature gradients up and promoting Fan Efficiency Degradation. Lower flow also alters pressure fluctuations, helping reduce excitation amplitude but limiting cooling margin.

Shift in fan performance curves under reduced pressure conditions

Under reduced ambient pressure, the axial fan’s operating point shifts on the speed–pressure/flow map, not just by scaling output but by moving where your blade flow field intersects the system resistance. In your thermal/CFD model, air density effects alter achievable pressure rise, so the Ambient Pressure Fan Performance curve “tilts” toward lower mass flow and different efficiency. You’ll also see stability margins shrink: low speed stall can emerge earlier as incidence changes, and blade tip leakage grows because pressure gradients across the tips weaken thrust recovery while exciting unsteady loading. Track the curve shift with:

  • Updated air density in the momentum model
  • Recomputed pressure-volume constraints on duct losses
  • Stall boundary monitoring vs blade loading metrics
  • Tip-leakage correction tied to pressure ratio

Practically, this changes power requirements and cooling capacity.

Efficiency and Power Consumption at Variable Pressures

fan efficiency drops with pressure

When ambient pressure drops, air density falls and you effectively reduce the mass flow, so the fan has to draw higher shaft power to meet the same cooling and pressure rise demands. As a result, axial fan efficiency—especially total efficiency—shifts with density, typically degrading as you move from 1 atm toward 0.3 atm due to off-design slip and altered flow angles. Your test observations should show measurable performance loss at these lower pressures, alongside changes in airflow-driven thermal loads and the vibration/torque signatures tied to the power requirement.

How lower air density affects the power required by the fan

At reduced ambient pressure, the fan ingests air with lower density, so for the same volumetric flow rate your axial fan must overcome less “mass” inertia while delivering less momentum change per unit volume—effectively shifting the operating point on its fan curve. In ambient pressure fan performance terms, you should model shaft power as scaling with density and pressure rise, then couple it to blade loading and stall margin under High altitude thermodynamics. Lower air density also alters convective heat transfer on the radiator side, so you may need heat exchanger scaling to keep cooling capacity stable.

  • Reduce required mass-flow for target volumetric flow
  • Lower density drops dynamic pressure, changing blade torque
  • Predict vibration shifts via altered thrust and inflow
  • Validate with airflow/thermal coupling, not RPM alone

Changes in fan efficiency (e.g., total efficiency) with ambient pressure

Ambient pressurePredicted efficiency shiftDominant mechanism
LowerSlight reductionIncreased incidence losses
ModerateNear-constantBalanced loading
HigherImprovementReduced wake dissipation
VariableHysteresis riskUnsteady stall margin

Experimental data showing performance degradation at lower pressures (e.g., 1 atm down to 0.3 atm)

  • Track efficiency vs. corrected flow
  • Record power vs. static pressure
  • Monitor vibration spectra for resonance shifts
  • Validate density-based scaling for high altitude operation

Cooling Capacity Implications

high altitude reduced air cooling

At high altitude, the reduced ambient pressure lowers air density, so you get a smaller effective mass flow rate and weaker convection, which cuts cooling capacity. In your airflow/thermal model this shifts engine and heat-exchanger temperatures upward, making it harder to stay within target operating margins even if fan speed holds. To compensate, you adjust duty cycles and control airflow targets while monitoring vibration and duct impedance so the system still delivers adequate cooling capacity under Air Density Effects conditions.

Reduced heat transfer capability due to lower mass flow rate

When ambient pressure drops at higher altitude, your axial fan usually delivers a lower mass flow rate, which directly reduces the convective heat-transfer coefficient and the overall cooling capacity of the locomotive radiator and heat exchangers. In thermal resistance terms, you’re increasing the effective hot-side path, so Reduced thermal resistance doesn’t occur—you lose margin. Your airflow model also shifts: fewer air molecules at the same volumetric flow lowers surface-side Nusselt performance, degrading Ambient Pressure Fan Performance. That weakening can accelerate heat exchanger fouling impacts, because higher wall temperatures promote deposit formation and reduce wetted effectiveness.

  • Lower mass flux: weaker convection, higher ΔT
  • Reduced air density effects on axial fan efficiency
  • Hot-spot growth: vibration-responsive airflow pulsation
  • Fouling feedback: rising thermal resistance over time

Challenges in maintaining optimal engine temperatures at high altitudes

Because high altitude reduces air density and weakens convection, you can’t rely on the same cooling margin to hold the EMD 9518890 traction diesel within its target temperature band. With lower mass flow, your thermal resistance rises nonlinearly, so hotspot rise rates accelerate during sustained load. You should run CFD simulation to quantify reduced axial fan heat-removal capacity and predict coolant-to-head temperature gradients under Air Density Effects and High Altitude Operation.

As airflow weakens, you also amplify cyclic thermal stresses, driving material fatigue and loosening thermal clearances. In parallel, altered flow incidence can excite structural modes, so you must apply vibration monitoring to track bearing and duct resonances. Over time, lower pressure-driven impingement raises local wear, increasing blade erosion. Ambient Pressure Fan Performance shifts accordingly.

Compensatory strategies for maintaining adequate cooling

To keep the EMD 9518890 traction diesel inside its target temperature band under Air Density Effects, you compensate for reduced cooling capacity by forcing higher effective heat rejection with the same installed hardware. You adjust Ambient Pressure Fan Performance through airflow modeling: lower air density reduces convective h, so you increase local velocity via controlled Blade Pitch and stricter flow guidance. You also manage vibration and Noise Mitigation so the tightened operating envelope doesn’t excite blade modes.

  • Increase fan speed setpoints while respecting power requirements and surge margins
  • Refine Blade Pitch schedules to maintain target mass flow at high altitude operation
  • Add ducting/routing tweaks to reduce recirculation losses and stabilize thermal gradients
  • Implement balancing and damping to suppress tonal noise and vibration coupling under changing air density

Experimental and Numerical Investigations

ambient pressure fan efficiency

You start by running controlled test runs that sweep ambient pressure to map Ambient Pressure Fan Performance against air density effects, while logging pressure-volume behavior, power draw, and cooling response to isolate what changes in Axial Fan Efficiency. Next, you contrast blade-count and geometry variants at each pressure point, and you watch vibration signatures to ensure the airflow-driven unsteady loads don’t reduce efficiency or thermal stability during high altitude operation. Finally, you couple CFD-style airflow modeling with thermal loads to predict performance at each ambient pressure level and validate the numerical curves against your experimental observations.

Methodologies for testing fan performance at various pressures

  • Mount axial instrumentation and ensure pressure tap calibration against reference transducers
  • Perform acoustic power measurement in quasi-anechoic conditions to separate acoustic loading from flow
  • Validate CFD with measured mass-flow, swirl, and pressure rise correlations at each pressure setpoint
  • Apply run-up/coast-down protocols to capture transient efficiency and avoid flow hysteresis

Use consistent data reduction to map axial fan efficiency trends for high altitude operation.

Comparison of fan designs (e.g., blade count) under different pressure conditions

Blade geometry and aerodynamic loading set how Ambient Pressure Fan Performance responds as air density and static pressure change, so you need a side-by-side comparison of EMD 9518890–type axial designs across the test pressure setpoints. Increase blade count and you raise blade solidity, shifting incidence and diffusion; the airflow model will show higher pressure rise but tighter operating margins at reduced density.

Decrease blade count and you reduce blockage, yet torque per unit flow can climb when static pressure drops, impacting axial efficiency and cooling capacity. You also track Tip Clearance Effects: at high altitude operation, thinner pressure gradients amplify leakage, weakening the local swirl and altering thermal removal rates. Vibration control metrics follow these changes, since altered loading redistributes thrust harmonics. In tests, pair designs at equal flow and log efficiency trends.

Use of numerical modeling to predict performance at varying ambient pressures

Numerical modeling lets you map Ambient Pressure Fan Performance before you ever cut metal, by coupling inlet air-density and pressure-volume effects to an axial-fan flow solver for the EMD 9518890–type geometry. In your workflow, you run an Atmospheric Simulation across altitude-like states, then let a Computational Fluid model update blade loading, swirl losses, and fluctuating pressure spectra. You perform pressure scaling to track how air density effects propagate into Axial Fan Efficiency, power requirements, and cooling capacity while keeping vibration-control margins tight.

  • Build performance mapping curves vs. ambient pressure
  • Calibrate turbulence and tip-clearance damping
  • Compute temperature-rise impact on motor bearings
  • Validate trends against experimental high-altitude operation

This approach highlights high altitude operation risks early.

Do fans consume more energy at higher altitudes? Yes, typically more power per delivered cooling due to reduced density and altered operating point. How do locomotive cooling systems account for mountain passes? They adjust fan control schedules and shroud/duct constraints to maintain radiator ΔT under pressure drops. What is the lowest operational pressure tested for these fans? In published studies for this class, the lowest tested ambient pressure is typically around 80 kPa.

Design Considerations for Variable Pressure Environments

adaptive fan control for density

When you size the EMD 9518890 for broad operational envelopes, you account for air density effects on volumetric flow, axial fan efficiency, and the resulting power requirements. You then integrate adaptive control that senses ambient pressure and adjusts fan speed to hold cooling capacity targets while limiting vibration loads. Finally, you validate performance through thorough testing of these aerospace-derived components across the lowest anticipated ambient conditions to prevent thermal and airflow model drift.

Fan sizing and selection for broad operational envelopes

To size the EMD 9518890 axial fan for broad operational envelopes, you start with an air-density-driven performance map—because ambient pressure shifts the inlet density, moves the operating point along the pressure–volume curve, and changes the aerodynamic loading. You then validate Ambient Pressure Fan Performance using coupled airflow–thermal models, ensuring cooling capacity stays stable under Air Density Effects and High Altitude Operation. In selection, you also manage Blade Tip Clearance to prevent efficiency loss and Acoustic Noise Levels growth as Reynolds number changes.

  • Define target pressure-volume bands across altitude steps
  • Compute power requirements using density-corrected fan laws
  • Check cooling margin via transient heat-transfer model
  • Limit vibration via stiffness–thrust margin and modal clearance

This approach keeps axial Fan Efficiency predictable under varying conditions.

Adaptive control systems to adjust fan speed based on ambient conditions

Once you’ve validated Ambient Pressure Fan Performance across the air-density-driven pressure–volume bands, you can keep the EMD 9518890 near its peak Axial Fan Efficiency by adding adaptive speed control tied to measured ambient conditions. In your airflow model, estimate air density effects and compute corrected volumetric flow, then schedule fan RPM to maintain target cooling capacity and power requirements without pushing the operating point into stall.

Implement Blade Stall Detection using rise in pressure drop, acoustic signatures, and motor current spikes, and feed it into Thermal Feedback Integration from bearing and housing thermistors. When ambient shifts for high altitude operation, your controller adjusts duty to hold blade loading, stabilizes thermal gradients, and reduces vibration growth, preventing surge cycles and maintaining steady torque.

Importance of thorough testing for aerospace-derived components in locomotives

Thorough testing matters because aerospace-derived components like the EMD 9518890 axial fan operate across variable-pressure air-density bands that shift volumetric flow, blade loading, and heat rejection. When you validate Ambient Pressure Fan Performance, you align airflow modeling with thermal constraints and vibration control, so performance stays stable under Air Density Effects and high altitude operation.

  • Run Fatigue testing across duty cycles that mimic rail stress and cycling cooling demand
  • Confirm durability assurance for rail stress via modal and resonance sweeps under low-pressure flow
  • Build certification compliance evidence by correlating measured pressure-volume relationships to simulations
  • Maintain standards qualification tracking with repeatable test matrices for cooling capacity and power requirements

This approach hardens thermal margins, reduces bearing fatigue, and supports accurate experimental observations.

Frequently Asked Questions

How Does Ambient Pressure Change Noise Levels of Axial Fans?

As ambient pressure drops, acoustic impedance falls, so pressure-driven sound radiation changes and tonal components often shift. You also get altered inlet turbulence intensity: lower air density can reduce aerodynamic forcing per unit mass, lowering broadband noise, but it can increase flow unsteadiness at the same RPM, which raises high-frequency hiss. In your airflow model, you’ll track changes in Mach number, blade loading, and vibration excitation to predict net noise trends.

Can Blade Pitch Adjustments Compensate for Ambient Pressure Fluctuations?

Blade pitch adjustments can partially compensate for ambient pressure fluctuations, but only if you implement model based control with pitch scheduling dynamics tied to inlet air density. In your airflow modeling, higher/lower air density shifts mass flow, so you retune pitch to hold target cooling capacity and axial fan efficiency. Thermal analysis and power requirement estimates guide the pitch rate. You also monitor vibration control, since mismatched pitch can amplify surge and tonal noise.

What Bearing Loads Result From Altered Fan Aerodynamic Thrust?

Ambient thrust shifts the momentum balance, so altered fan aerodynamics generate higher axial and radial bearing loads. You can model this as ΔFa ∝ Δ(air-density·flow²), then propagate it into bearing reaction forces and resulting vibration spectra. In thermal terms, higher loads mean more friction heat in the bearing housings, raising temperatures. Satirically, your bearings “love” change—until fatigue shows up. For what is worst? you’d see peak loads near transient throttle.

How Quickly Does Fan Performance Adapt After Entering High Altitude?

After you enter high altitude, the fan’s performance adapts within seconds as air density drops and pressure-volume relationships shift; altitude responsiveness follows the fluid transient time, not the full thermal soak. You model airflow stabilization by tracking mass-flow decay, RPM control, and rising flow resistance. Power requirements and cooling capacity change immediately, while vibration control benefits once the inlet pressure gradient re-equilibrates, typically after a few rotor cycles.

Do Ambient Pressure Changes Affect Motor/Drive Efficiency Directly?

Yes—ambient pressure changes can affect Motor Efficiency directly. Picture a locomotive fan as a “breathing” heat exchanger: when air density drops, your airflow rate and convective cooling shift, raising motor winding temperatures and losses. In airflow modeling, reduced density alters pressure-volume work, so drive torque demand and Directly Effects on inverter currents rise. Field tests at altitude often show higher motor temperatures and modest efficiency loss, especially under steady load.

What Specific Materials Are Typically Used in the Construction of a 48” Locomotive Fan Assembly?

What Specific Materials Are Typically Used in the Construction of a 48” Locomotive Fan Assembly?

Users often face premature fan blade wear and efficiency loss. Hot airflow and vibration can drive erosion, oxidation, and fatigue cracks. This shortens service intervals and raises downtime costs. Choosing the right materials helps reduce damage and preserves stable airflow performance over time.

To overcome these issues, we source genuine locomotive engine parts for demanding fan assemblies. As Mikura International, we supply and import/export authentic components from major OEMs, including ALCO, EMD, and GE. We help customers match correct materials and specifications for reliable operation.

Typical materials used in a 48” locomotive fan assembly

  • Heat-treated carbon steel for blades, hub, and structural frame.
  • Controlled ferrite–pearlite microstructure for dimensional stability.
  • High tensile strength to resist vibration loads.
  • Good weldability for field and shop fabrication.
  • Ni-Cr-Fe hardfacing overlays on leading edges.
  • Erosion and oxidation resistance at the blade entry zone.
  • Thermally stable barrier coatings near the surface.
  • Fatigue resistance under cyclic hot airflow.

Why these materials are chosen

Heat-treated carbon steel supports strength and stable geometry. Hardfacing improves leading-edge durability. Barrier coatings help maintain hardness near the surface. Together, they improve fatigue life and long-term structural rigidity.

Quick comparison table (what each material protects)

Fan component areaTypical material / treatmentPrimary failure riskMaterial benefit
Blades (bulk)Heat-treated carbon steelFatigue crackingHigh tensile and fatigue strength
HubHeat-treated carbon steelCyclic stressStable structure and rigidity
FrameHeat-treated carbon steelDistortion and looseningDimensional stability under load
Leading edgesNi-Cr-Fe hardfacingErosion, oxidationDurable surface against hot flow
Near-surface zoneBarrier or ceramic-type coatingHardness lossHelps preserve surface hardness

Sourcing note from Mikura International

Material selection must match the original locomotive design. We supply genuine locomotive engine parts and related components. This includes authentic parts aligned with OEM specifications and durability needs.

Key Takeaways

  • Carbon steel is commonly used for fan blades and structural members for strength, machinability, and heat-treatment-controlled microstructure stability.
  • Weldability and predictable thermal expansion of the steel help maintain dimensional clearances under hot airflow and cyclic temperature changes.
  • Fatigue-resistant material selection and controlled hardness target blade-root, hub, bolt, and weld-toe durability under vibration and start-stop cycling.
  • Ni-Cr-Fe alloys and hardfacing/overlays protect leading edges and high-impact zones against particle erosion and oxidation at operating temperature.
  • Coatings and surface treatments (including ceramic/carbide or barrier topcoats) reduce abrasive wear, corrosion propagation, and maintenance needs.

Introduction to Material Selection in Heavy Machinery

high stress fan material selection

When you choose Locomotive Fan Materials, you’re balancing material science with durability to secure long-term reliability under cyclic loading and vibration. You must account for harsh locomotive operating conditions—heat swings, abrasive airflow, and impact loads—so thermal-stability and structural-rigidity stay intact over time. You’ll compare common large-fan options (high-strength metallic alloys and other engineered materials) to match performance engineering needs.

Importance of material properties for long-term reliability

For long-term reliability in heavy-duty locomotive fan assemblies, you can’t treat “materials” as a single choice—you must match material properties to the duty cycle. As you select Locomotive Fan Materials, you manage Corrosion mechanisms by choosing alloys with stable oxide behavior, controlling galvanic effects, and ensuring surface chemistry resists moisture and contaminants.

You also design against abrasive particle wear by pairing hard, wear-resistant microstructures with tough substrates, so impacts don’t turn into progressive edge loss. For thermal-stability, you prioritize low creep, predictable thermal expansion, and retention of strength across operating temperatures. For structural-rigidity, you account for fatigue strength at blade roots, joint stiffness, and damping so vibrations don’t loosen fasteners. You apply material science and performance engineering criteria early to prevent service failures.

Harsh operating conditions in locomotive environments

Locomotive fan assemblies operate under abrasive dust, cycling temperatures, moisture, and vibration, so your material choices must account for more than strength alone. You target high-wear surfaces to limit Particle Erosion at blade leading edges and seal interfaces. You also select alloys or engineered composites with thermal-stability, so expansion stays controlled across hot/cold cycles without warping or losing clearances. For structural-rigidity, you choose materials with good stiffness-to-mass so vibration doesn’t amplify fatigue at hubs, bolts, and mounting rings. Moisture exposure drives corrosion-resistant grades and surface treatments, while lubricant compatibility matters: you confirm seals, coatings, and elastomers won’t degrade, swell, or contaminate airflow under service chemicals.

Overview of common materials in large fan construction

Selecting locomotive fan materials starts with balancing material science requirements against the realities of heavy machinery—temperature swings, abrasive dust, and vibration loads. You typically pick metallic alloys for blades and hubs: stainless steels or nickel-based alloys offer corrosion resistance and dependable fatigue strength. For the frame, carbon steel with proper heat treatment gives structural-rigidity without excessive mass. You also use composite materials selectively, such as glass-fiber or carbon-fiber reinforcements, to reduce weight while maintaining stiffness at speed. Because erosion resistance matters, you choose wear-toughened leading edges and apply protective coatings. You then build Corrosion Monitoring into inspections, and you use Predictive Maintenance models to schedule replacements before micro-cracks or thinning compromise performance.

Metallic Components: Alloys for Strength and Durability

carbon steel fatigue weldability

When you select Locomotive Fan Materials, start with carbon steel for fan blades and structural elements because it delivers high strength, reliable weldability, and cost-effective manufacturing. You also need to check thermal stability so the alloy keeps stiffness under service temperatures and heat cycling. Finally, you design for fatigue resistance by aligning carbon steel grade and geometry with expected cyclic loading to protect against crack growth over time.

Use of carbon steel for fan blades and structural elements

Carbon steel often anchors locomotive fan blade and structural assemblies because it delivers a strong balance of tensile strength, machinability, and cost-effective durability. You rely on heat treatment and microstructure control to stabilize properties under hot airflow, vibration, and cyclic load, so your fan keeps stiffness where it matters. For material-selection, you choose grades that respond predictably to tempering and controlled cooling, minimizing brittle transformations. Structurally, you use carbon steel for webs, hubs, and blade roots to maintain rigidity and resist fatigue crack initiation. To engineer it for performance engineering, you target:

  1. Controlled ferrite–pearlite ratios
  2. Tight dimensional tolerances after machining
  3. Tempered hardness matched to wear conditions
  4. Predictable thermal-expansion behavior during service

Advantages of steel: high strength, weldability, cost-effectiveness

Steel brings locomotive fan assemblies a practical mix of high strength, reliable weldability, and cost-effective performance**, letting you build rigid structures that hold alignment under hot airflow and vibration. When you select locomotive fan materials like mild or low-alloy steel, you get a stiffness-to-weight balance that supports structural-rigidity in the hub, frame, and mounting brackets. You also benefit from predictable thermal-stability: steel holds dimensional control as temperatures rise, so your blade clearances stay consistent.

Its weldability helps you join components with fewer inserts, improving assembly quality and sealing interfaces. That tight build supports Quieter Operation by reducing slack and flow-induced chatter, while Vibration Damping** improves because the bulk steel structure absorbs energy before it transfers. You also keep costs manageable for large production runs.

Considerations for fatigue resistance in cyclic loading applications

Fatigue resistance governs whether your locomotive fan assembly keeps its structural-rigidity through thousands of start-stop cycles, high-amplitude vibration, and fluctuating aerodynamic loads. You’ll start with load spectrum analysis to quantify stress ranges at blade roots, hubs, and weld toes, then run Finite life modeling to estimate cycles to crack initiation. Choose locomotive fan materials with high fatigue strength and good notch tolerance, and match yield strength to avoid overstrain that accelerates crack growth. You should also consider thermal-stability, since heat cycling shifts elastic modulus and residual stresses.

  1. Minimize stress concentrators and sharp transitions
  2. Use controlled weld procedures and inspections
  3. Select alloys with proven fatigue strength data
  4. Validate with vibration testing under real duty cycles

Surface Treatments and Coatings for Enhanced Performance

ni cr fe blade surface coatings

When you select Locomotive Fan Materials, applying Ni-Cr-Fe alloys to the blade surface helps you resist erosion and abrasive particles while tolerating corrosive environments. Choose surface treatments that stay stable under your operating temperatures so you preserve structural rigidity and don’t lose hardness at heat. These coatings directly extend lifespan and cut maintenance by reducing wear-driven fatigue and corrosion propagation.

Application of Ni-Cr-Fe alloys for erosion resistance

Ni-Cr-Fe alloys deliver a robust foundation for locomotive fan blades exposed to particle-laden airflow, because you can engineer the surface to resist erosive wear without sacrificing thermal-stability. When you select Locomotive Fan Materials, you target Abrasive Wear by applying Ni-Cr-Fe claddings or weld overlays, then you use Surface Hardening to lock in a hard, tough near-surface microstructure. For Material Science, you tune alloy content and heat treatment so the oxide film and matrix stay stable at fan operating temperatures. Your design also benefits from structural-rigidity: the blade base remains strong while the outer layer handles impact.

  1. Choose Ni-Cr-Fe for wear-resistant phase stability
  2. Apply hardfacing overlays for erosion control
  3. Heat-treat for reliable Surface Hardening response
  4. Verify hardness-depth vs. operating temperature limits

Protection against abrasive particles and corrosive environments

To keep locomotive fan assemblies reliable in abrasive, corrosive air, you pair Locomotive Fan Materials with surface treatments and coatings that lock in thermal-stable chemistry and strong near-surface protection. You start by using erosion mapping to identify where particle impact concentrates, then target those zones with hard, wear-resistant layers. For high particle impact, choose ceramic- or carbide-based coatings, or sprayed cermets, to resist cutting and micro-ploughing while maintaining structural rigidity. To suppress corrosion mechanisms, you apply corrosion-blocking primers and sealers, then finish with dense barrier topcoats that limit electrolyte access. You also control coating thickness and adhesion so coating durability survives thermal cycling and vibration-driven cracking, preserving performance under continuous abrasive flow.

Impact of coatings on material lifespan and maintenance

Surface treatments and coatings extend your locomotive fan assembly’s service life by protecting the near-surface region where abrasive impacts, hot oxidation, and corrosive species work together. When you choose locomotive fan materials, you also choose how coatings survive thermal cycling and maintain coating adhesion under load. High-temperature polymer, ceramic, or metal-oxide layers reduce corrosion mitigation without softening or cracking. You’ll typically specify:

  1. Surface roughness control for strong coating adhesion
  2. Oxidation-resistant ceramic topcoats for thermal stability
  3. Galvanic or barrier primers to block corrosive ions
  4. Wear-capable sealants at leading edges for erosion resistance

If your coating system matches your alloy’s expansion, you’ll preserve structural rigidity, slow crack initiation, and cut maintenance intervals.

Advanced Materials and Composites

lightweight high stability composite blades

You can explore lightweight composite materials for locomotive fan blades to target structural rigidity with higher thermal stability while cutting rotating inertia, which boosts performance engineering efficiency. You’ll gain reduced inertia, better vibration dampening, and strong material science options tailored to wear and fatigue needs, but you must weigh higher cost and tougher repairability. You’ll also need to confirm specific environmental resistances—like moisture, chemicals, and erosion—so durability holds under real service conditions.

Potential applications of lightweight composite materials for fan blades

Lightweight composite materials can significantly improve fan-blade performance when you prioritize high specific stiffness, corrosion immunity, and stable operation under heat. If you’re selecting Locomotive Fan Materials, you can use carbon-fiber/epoxy or glass-fiber composites for structural-rigidity while keeping added mass limited. You should assess Vibration damping by mapping expected blade resonance modes, then validate the layup with impact testing to confirm residual strength after hail or debris strikes. For thermal-stability, you’ll choose resins with high glass-transition temperatures and robust fiber-matrix adhesion. You also ensure composite bonding quality through controlled curing and surface preparation.

  1. Carbon-fiber reinforced laminates
  2. Glass-fiber with toughened epoxies
  3. High-Tg thermoset matrices
  4. Quality-controlled adhesive bonding seams

Benefits: reduced inertia, improved efficiency, and vibration dampening

Reduce rotating inertia and sharpen aerodynamic response by using advanced composite structures in locomotive fan assemblies. You select Locomotive Fan Materials that stay stiff under load, so your hub and blades track the intended Computational blade Dynamic. Lower mass lets you spin with less torque, improving efficiency while holding blade pitch accuracy. You also tune laminate stacks to damp finite element Vibration modes, reducing fatigue-driving resonances.

Design goalMaterial traitSelection method
Low inertiaFiber-reinforced low densitymass/section optimization
Thermal stabilityResin with high Tgthermal soak + NDE
Vibration dampeningViscoelastic interlayersfinite element Vibration tuning
Structural rigidityHigh modulus fibersply orientation mapping
Reliability in servicedurable matrixMaterial Science validation

Challenges: cost, repairability, and specific environmental resistances

Cost and repairability often shape your practical choices for Locomotive Fan Materials as much as stiffness and strength do. You weigh up-front machining and joining costs against downtime risk, because welding challenges at blade roots can drive scrap rates. You design for field repairs using standardized fasteners, accessible liners, and predictable thermal expansion matches. For structural-rigidity, you select alloys or composites that keep modulus at operating temperatures and resist distortion. You also budget for corrosion management: coatings and compatible metals limit galvanic attack and moisture creep. To handle abrasive wear, you specify erosion-resistant leading-edge surfaces and sacrificial wear bands.

  1. Minimize service time with modular assemblies.
  2. Choose wear liners to survive abrasive wear.
  3. Match thermal cycles to prevent stress.
  4. Plan corrosion management with coatings.

Material Selection Criteria

high strength heat resistant fatigue

When you select locomotive fan materials, you prioritize a high strength-to-weight ratio so the assembly stays rigid without adding unnecessary mass. You also verify temperature resistance and fatigue strength under vibration-induced stress, since thermal cycling and fluctuating loads can loosen joints or trigger cracks. Finally, you run a cost-benefit analysis across metallic alloys and composites to balance performance engineering goals with long-term durability.

Factors influencing material choice: strength-to-weight ratio, temperature resistance

You’ll want to treat material selection as a coupled design problem: strength-to-weight ratio sets the blade and hub stiffness you need for efficient airflow, while thermal-stability governs whether that stiffness and dimensional accuracy survive sustained service. If you target high stiffness with low mass, you reduce deflection and keep aerodynamic performance predictable. You also consider vibration damping needs, balancing modulus with internal damping so resonant motion doesn’t amplify loads. For thermal resistance, you choose alloys or composites that retain yield strength and creep resistance across your duty cycle, limiting hub-bore growth and seal misalignment. You screen candidates for corros ion behavior, because hot moisture and exhaust chemistry attack surfaces.

  1. Specific stiffness targets
  2. Creep/thermal aging limits
  3. Vibration damping capability
  4. Corrosion behavior suitability

Resistance to vibration-induced stress and fatigue

To keep a locomotive fan assembly stable under cyclic loads, you design for resistance to vibration-induced stress and fatigue, not just static stiffness. You favor Locomotive Fan Materials with high fatigue strength, good damping, and stable modulus so thermal cycling doesn’t amplify vibration. You control Weld Quality because poor fusion sites become initiation points for Crack Propagation under fluctuating stress. You validate eigenfrequencies with Resonant Testing, ensuring blade, hub, and mounts avoid operating near resonance. For structural-rigidity, you select alloys or composites that maintain geometry and load paths over time.

FeatureSelection targetWhy it matters
Weld Qualityfull penetrationreduces crack starters
Crack Propagationlow growth rateslows fatigue failure
Resonant Testingshifted modesavoids resonant amplification

Cost-benefit analysis of different material options

Cost-benefit analysis of Locomotive Fan Materials starts with life-cycle performance, not purchase price, because fatigue, wear, and thermal cycling drive the real operating cost. You should compare options by Life Cycle Costing: alloy blades may cost more upfront but reduce downtime via higher fatigue strength and stiffness. Composite blades can cut mass and improve performance engineering, yet you must price in inspections, erosion resistance, and Repairability Tradeoffs. Focus on how each material holds dimensional control under heat, vibration, and airflow impacts.

  1. Alloy (high-nickel/steel): best stiffness and predictable fatigue strength
  2. Aluminum alloys: lower mass, moderate thermal stability
  3. Composites: high strength-to-weight, erosion and bond-risk checks
  4. Coatings/liners: extend durability against wear and hot oxidation

Challenges and Future Outlook in Material Science

corrosion erosion resistant materials

You’ll face long-term challenges as locomotive fan materials degrade from corrosion and erosion, especially where airflow and moisture combine. You can improve durability by selecting alloys and composites with stronger fatigue strength and tighter thermal-stability margins, then pairing them with advanced coatings for sustained erosion resistance. Looking ahead, you’ll also need to meet evolving fire-resistance standards while maintaining structural rigidity under heat and vibration for reliable performance engineering.

Addressing material degradation (e.g., corrosion, erosion) over time

  1. Select corrosion-resistant base metals
  2. Apply protective coatings and sealants
  3. Use surface hardening layers for abrasive wear
  4. Monitor thermal cycles and microcrack growth

Innovations in material science for improved fan durability

As material science advances, you can push locomotive fan assemblies toward higher thermal stability and better structural rigidity by targeting the failure modes you actually face—fatigue, erosion, and thermally driven microcracking—rather than treating durability as a single property. In practice, you select Locomotive Fan Materials that retain strength under thermal cycling, resist crack growth, and tolerate particle-laden airflow. You pair oxidation- and corrosion-resistant metallic matrices with interfacial toughening for stiffness without brittleness. You use corrosion monitoring hooks and temperature-sensitive sensors so predictive maintenance flags early attack before blade thickness drops. You apply 3D printing to tailor lattice cooling paths and reinforce high-stress roots, then run heat affected optimization to minimize property loss from joining or machining.

Meeting fire resistance standards for rail vehicle components

  1. Flame-retardant matrix chemistry
  2. Thermally stable oxidation barriers
  3. Verified thermal shock and fatigue strength
  4. Low creep strain at peak heat

This Material Science approach protects Durability and Performance Engineering margins.

Frequently Asked Questions

Which Alloys Best Resist Blade Fatigue Under High Cyclic Loading?

When you need blade fatigue resistance under high cyclic loading, pick nickel-based superalloys like Inconel 718 or 625, and precipitation-hardened stainless steels such as 17-4PH. These alloys handle Thermal cycling well, maintaining strength and damping microcrack growth. For tougher corrosion fatigue, use coatings plus titanium-based or high-chromium alloys to resist pitting. Stress-relieved heat-treated structures improve fatigue strength and keep structural-rigidity. Like a shield, correct alloying delays failure.

What Manufacturing Methods Improve Strength in Locomotive Fan Hubs?

To improve strength in locomotive fan hubs, you use forging or precision casting to densify the hub material, then apply machining and controlled heat treatment. You follow up with stress relief to stabilize microstructure and reduce distortion, especially after heavy removal. You verify structural-rigidity using finite element analysis to spot stress concentrations near the hub bore and fillets. You choose thermally stable alloys so performance holds under cycling temperatures and vibration.

How Do Leading-Edge Materials Reduce Erosion From Airborne Debris?

You reduce erosion from airborne debris by using leading-edge materials engineered for abrasive particle impacts. Think “an ounce of prevention is worth a pound of cure.” You apply erosion resistant coatings that harden the surface, resist micro-cutting, and limit crack initiation. You also select thermally stable alloys or composites to maintain hardness under heat, and you reinforce structural-rigidity so the blade doesn’t flex, lowering repeated impact fatigue and wear.

What Balance of Weight and Stiffness Matters Most in Fan Blades?

You need the right balance of weight and stiffness to keep blades stable at high tip speed design. Choose materials that maximize modal stiffness optimization per unit mass, so the blade resists bending and avoids resonance. You prioritize structural-rigidity at the hub and along the span, then select alloys or composites with strong fatigue strength. Also target thermal-stability, so stiffness stays predictable as operating temperatures swing. That combo reduces vibration, wear, and failure risk.

Which Tests Verify Durability Before a Fan Assembly Enters Service?

Which tests prove durability to guarantee before your 48” locomotive fan ever enters service? You verify with load testing, measuring structural rigidity, and run nonlinear vibration trials to expose resonances. You perform fatigue validation using accelerated stress cycles that match expected duty loads. You confirm environmental endurance by spraying, corrosion, and abrasion checks. You also run thermal cycling to measure thermal-stability and ensure material properties hold through hot starts and cooldowns.

How Does the Blade Design of EMD’s 9518890 Fan Assembly Influence Its Efficiency and Noise Profile?

How Does the Blade Design of EMD’s 9518890 Fan Assembly Influence Its Efficiency and Noise Profile?

A common concern with the EMD 9518890 fan assembly is poor cooling with high noise. Many locomotive operators face rising temperatures, energy loss, and louder fan performance over time. Much of this comes from blade wear, airflow imbalance, or design features at the blade tip, including whether winglet-style geometry is present.

  • High fan noise often signals airflow disturbance at the blade tips.
  • Weak cooling may result from poor blade condition or inefficient geometry.
  • Tip vortex losses can reduce airflow efficiency.
  • Blade damage can increase power consumption.
  • Uneven blade loading may create vibration.
  • Excess noise can affect locomotive operating comfort.
  • Small blade profile changes can alter fan performance.
  • Genuine parts help maintain original airflow behavior.
Common Pain PointLikely Blade-Related CausePractical Effect in Locomotives
High noiseTip turbulenceLouder cooling fan operation
Reduced coolingInefficient blade airflowHigher engine temperatures
Increased power drawHigher aerodynamic lossesMore load on the drive system
VibrationUneven blade conditionReduced operating smoothness
Inconsistent performanceBlade wear or geometry deviationUnstable cooling output
  • In locomotive cooling systems, blade design strongly affects both efficiency and noise. This is true for the EMD 9518890 fan assembly as well.
  • Features near the blade tip can influence how smoothly air moves through the fan.
  • When blade tips allow strong vortex formation, airflow energy is lost. This loss reduces aerodynamic efficiency. It can also raise noise levels.
  • A winglet-style tip can help control this effect by weakening the tip vortex.
  • This change improves airflow behavior across the blade span. It helps the fan move air with less wasted energy.
  • In locomotive service, that means more effective cooling for the same input power. It may also support more stable fan operation under varying load conditions.
  • Blade-tip refinements can also improve the noise profile. Less turbulence at the tip usually means less tonal and broadband noise.
  • This is important in locomotive environments, where cooling fans operate under demanding thermal conditions.
  • The blade shape also affects spanwise loading. Better load distribution reduces localized aerodynamic stress.
  • This can lower vibration tendencies and improve airflow consistency. These benefits support smoother fan performance in locomotive engine cooling systems.
  • Even small changes in camber or chord can affect the operating point. If the geometry shifts too far, airflow performance can drop.
  • Motor or drive power demand may also increase. That is why correct blade form matters in genuine replacement parts.
  • For buyers and maintenance teams, the key point is simple. Blade design is not only about moving air.
  • It also affects cooling efficiency, energy use, and fan noise.
  • In the EMD 9518890 fan assembly, winglet-like blade features can help reduce tip losses and support quieter operation.
  • Mikura International supplies genuine locomotive engine parts, including authentic components for EMD applications.
  • For the correct EMD 9518890 fan assembly and other genuine locomotive parts, Mikura International helps operators maintain proper fit, performance, and reliability.

Key Takeaways

  • Winglets on the 9518890 assembly reduce tip vortex intensity, suppressing induced drag by 10–15% and improving total-to-static efficiency by 2–5%.
  • Blade camber and chord length govern pressure differential and airflow, directly determining the fan’s pressure-rise coefficient and operating efficiency.
  • Winglets suppress tip leakage flow, improving spanwise pressure distribution uniformity by 6–12% and stabilizing attached flow across 80–90% of blade span.
  • Reduced tip vortex formation lowers broadband turbulence noise, measurably decreasing the fan assembly’s acoustic output at operating speeds.
  • Optimized sweep angle and chord length redistribute spanwise loading, reducing motor power demand and smoothing torque pulses during locomotive cooling operation.

Fundamentals of Fan Blade Aerodynamics

blade camber controls pressure differential

When you design a fan blade, the profile’s camber and chord length directly determine the pressure differential across each blade, governing how much air mass the fan moves per unit time. Your blade geometry—specifically its twist distribution and angle of attack—controls boundary layer behavior, where poor design triggers flow separation that reduces efficiency and spikes power draw. You’ll find that even small deviations in blade geometry can shift the fan’s operating point on its performance curve, forcing the motor to consume measurably more power to maintain target airflow.

Role of blade profile in air movement and pressure generation

The blade profile—its cross-sectional shape along the span—directly governs how a fan generates pressure and moves air. Airfoil camber determines the curvature that accelerates flow along the suction surface, creating the pressure differential essential for thrust. Increase camber too aggressively, and you compromise the stall margin, forcing the blade into separated flow at off-design operating points.

Computational fluid dynamics resolves these trade-offs quantitatively. Pressure contours mapped across the blade surface reveal localized high-pressure zones near the leading edge and suction peaks mid-chord. You can correlate these distributions directly with measured static pressure rise across the fan assembly. Optimizing the profile geometry—adjusting thickness-to-chord ratios alongside camber—lets you maximize pressure generation while maintaining attached flow across the full operating speed range.

Impact of blade geometry on flow stability

Pressure distribution shapes how air attaches to the blade surface, but geometry governs whether that attachment holds across varying load conditions. Blade sweep angle, chord length, and thickness-to-chord ratio directly determine your stall margin behavior by controlling the adverse pressure gradient along the suction surface. When geometry permits gradual pressure recovery, the boundary layer remains attached through a wider operating range.

Tip clearance effects compound this relationship—narrow gaps between blade tip and shroud reduce recirculation losses and suppress the tip vortex that destabilizes downstream flow. Conversely, excessive clearance amplifies turbulent ingestion at the leading edge, accelerating separation onset. You’ll find that optimizing chord taper toward the tip reduces local loading, effectively extending stall margin while minimizing the vortical structures that tight tip clearances alone cannot eliminate.

Relationship between blade design and fan power consumption

Beyond geometry’s role in flow stability, blade design directly governs how much shaft power your fan consumes to achieve a target airflow rate. Blade camber, chord length, and sweep angle collectively determine your fan’s pressure-rise coefficient and torque demand, directly feeding motor load estimation calculations.

Key design-power relationships include:

  • Camber angle increases raise pressure rise but elevate torque requirements, increasing shaft power by 8–15% if not optimized against target duty points
  • Chord length reduction lowers profile drag, cutting power consumption while shifting vibration onset criteria thresholds toward higher rotational speeds
  • Sweep optimization redistributes spanwise loading, reducing peak blade stress and smoothing torque pulses that inflate motor load estimation margins

Each parameter requires precise quantitative balancing to minimize consumed power without compromising structural integrity or aerodynamic stability.

Introduction to Winglets in Fan Design

blade tip winglet induced drag reduction

When you examine modern fan blade design, you’ll find that winglets—small fin-like extensions mounted at the blade tip—serve a critical function: redirecting tip vortex flow to reduce induced drag and minimize turbulent energy losses. You can configure these structures across several variables, including spanwise width (typically 2–8% of blade radius), chordwise location, deflection angle (ranging from 0° to 90°), and whether they’re positioned on the pressure side, suction side, or both. Originally developed in aviation to improve lift-to-drag ratios on fixed-wing aircraft—where Boeing’s 737 MAX winglets cut fuel consumption by roughly 5%—this technology has since transferred directly to axial fan engineering to address analogous tip-leakage inefficiencies.

Definition and purpose of winglets on fan blades

Winglets are small, angled extensions fitted at the blade tips of fan assemblies, and they directly address one of the most significant sources of aerodynamic loss in rotating machinery: tip vortex formation. When high-pressure air beneath a blade escapes around the tip toward the low-pressure surface, it creates turbulent vortices that reduce efficiency and amplify noise. Winglet function targets this leakage path, redirecting tip flow and suppressing vortex intensity.

Key purposes winglets serve in fan blade design:

  • Pressure recovery: They reduce tip leakage, improving spanwise pressure distribution
  • Noise mitigation: Suppressed vortex shedding lowers broadband turbulence noise by measurable decibel margins
  • Efficiency gain: Reduced induced drag translates directly into higher aerodynamic performance

These combined effects make winglets a critical design consideration for locomotive fan assemblies.

Different configurations of winglets (e.g., width, side, location, shape)

Not all winglets perform equally—geometry determines how effectively each configuration suppresses tip vortex formation and at what aerodynamic cost. Winglet placement, cant angle, chord width, and sweep collectively define vortex suppression capability. Blade tip vortices intensify when geometry fails to redirect leakage flow adequately, increasing both induced drag and tonal noise.

Configuration ParameterVariation RangePrimary Effect
Winglet placementPressure vs. suction sideControls leakage flow direction
Cant angle15°–90°Modulates vortex dissipation rate
Chord width5%–20% of blade chordAdjusts lift redistribution magnitude
Sweep angle0°–45°Affects leading-edge noise signature
Tip height1%–8% of blade spanScales vortex suppression intensity

Each parameter interacts nonlinearly, requiring coupled aeroacoustic analysis during design.

Historical application of winglets in aviation and their transfer to fans

Few engineering innovations have crossed disciplinary boundaries as productively as the winglet, which Boeing’s Richard Whitcomb developed in the 1970s to cut induced drag on commercial aircraft by redirecting wingtip vortex energy rather than dissipating it as aerodynamic loss. Fan engineers adopted this principle by targeting tip vortices—primary drivers of tonal and broadband noise mechanisms in axial fans. The transfer yielded measurable gains:

  • Efficiency: Winglets reduce tip leakage flow, recovering 2–4% of total pressure rise
  • Noise mechanisms: Disrupting tip vortex coherence lowers tonal blade-passing frequency noise by 3–6 dB
  • Structural adaptation: Aviation-derived cant angles (typically 45°–90°) were rescaled for fan blade chord-to-span ratios

You’re effectively applying century-scale aerospace learning to locomotive cooling systems.

Aerodynamic Benefits of Winglets

reduce fan tip vortex drag

When you add winglets to fan blades, you directly suppress the tip vortices that form at the blade’s outer edge, cutting induced drag by redistributing spanwise pressure gradients more uniformly. This redistribution flattens the pressure differential across the blade surface, reducing localized loading peaks that typically degrade aerodynamic efficiency. The net result is a measurable gain in fan efficiency—studies on axial fans report total-to-static efficiency improvements of 2–5% depending on winglet geometry and operating flow coefficient.

Reduction of tip vortices and induced drag

Because fan blades operate in a rotating flow field, pressure differentials between their suction and pressure surfaces drive high-velocity air to roll around the blade tip, forming concentrated tip vortices. These vortices increase induced drag, reducing aerodynamic efficiency. Winglet geometry directly counters this by redirecting tip leakage flow, suppressing vortex formation, and improving pressure recovery.

Quantifiable benefits of winglet-driven tip vortex reduction include:

  • Induced drag reduction: Winglets can decrease induced drag by 10–15%, improving overall fan efficiency
  • Tip speed control: By modifying local flow angles at the blade tip, winglets reduce tangential velocity losses
  • Pressure recovery: Redirected tip flow maintains stronger spanwise pressure gradients, increasing mass flow throughput

Together, these effects translate directly into measurable gains in aerodynamic output per unit of shaft power consumed.

Improvement in pressure distribution across the blade

By redirecting spanwise flow and suppressing tip vortex formation, winglets fundamentally alter the chordwise pressure distribution across the blade surface. You’ll observe a more uniform suction peak near the leading edge, reducing abrupt adverse pressure gradients that typically trigger boundary layer separation. Improved boundary layer effects stabilize the attached flow regime across 80–90% of the blade span, delaying the onset to turbulent separation.

This stabilization directly enhances pressure recovery dynamics along the trailing edge, where controlled deceleration of the boundary layer converts kinetic energy into static pressure more efficiently. Quantitatively, winglet-equipped blades demonstrate a 6–12% improvement in spanwise pressure uniformity compared to baseline configurations, translating into measurable gains in static pressure rise coefficient and overall aerodynamic loading efficiency across the fan assembly’s operational range.

Enhanced overall fan efficiency and airflow

  • Higher total-to-static efficiency: Reduced tip leakage lowers energy dissipation per unit of airflow delivered
  • Increased volumetric flow rate: Suppressed flow separation maintains blade loading across the full operating range
  • Broader efficient operating band: Winglet geometry delays stall onset, extending the fan’s usable performance envelope

These gains aren’t marginal. Properly optimized winglet configurations consistently demonstrate efficiency improvements of 3–8%, directly reducing locomotive cooling system power consumption without mechanical redesign.

Acoustic Impact of Winglets

upward canted winglets reduce tonal noise

When you add winglets to fan blades, you directly disrupt the tip vortex formation that drives tonal noise—the dominant acoustic signature in axial fan assemblies. Studies on optimized winglet configurations report reductions in blade-passing frequency tonal noise of up to 3–5 dB, with total sound pressure levels dropping by 2–4 dB depending on winglet cant angle and span. You’ll find that upward-canted winglets with a span-to-chord ratio near 0.15 consistently yield the best acoustic outcomes, though the precise geometry requires experimental validation through anechoic chamber testing to confirm performance across the full operating speed range.

Mechanisms by which winglets reduce noise

Noise in axial fans originates primarily from two aerodynamic sources: tonal noise, driven by periodic blade-passing pressure pulses, and broadband noise, generated by turbulent boundary layer interactions at the blade tip. Winglet flow control directly targets both mechanisms through three distinct suppression pathways:

  • Tip vortex attenuation: Winglets diffuse concentrated tip vortices, reducing velocity fluctuations and associated broadband pressure radiation by approximately 2–4 dB.
  • Tip noise suppression via loading redistribution: Winglets shift aerodynamic loading inboard, decreasing tip-region pressure differentials that drive tonal emissions.
  • Turbulent inflow mitigation: By controlling spanwise flow separation, winglets reduce turbulent kinetic energy entering the tip gap, directly attenuating broadband noise spectra.

Together, these mechanisms produce measurable acoustic improvements without requiring rotational speed reductions or shroud modifications.

Specific reduction in tonal noise and total sound pressure levels

These suppression pathways don’t just describe noise theoretically—they produce quantifiable reductions across specific frequency bands. Through tip vortex mitigation and reduced blade pressure variations, winglets deliver measurable acoustic gains at blade-pass frequency and its harmonics.

Noise MetricBaseline BladeWinglet Blade
Tonal (BPF) SPL87 dB(A)81 dB(A)
Broadband SPL79 dB(A)76 dB(A)
Total SPL91 dB(A)85 dB(A)

You can see a 6 dB(A) tonal reduction—a perceptually significant drop that halves perceived loudness. Winglets accomplish this by redistributing tip loading, attenuating the discrete pressure impulses that generate tonal peaks. Total sound pressure level drops by 6 dB(A), confirming that winglet geometry simultaneously addresses both tonal and broadband noise mechanisms.

Experimental findings on optimal winglet configurations for noise reduction

Experimental studies isolate which winglet configurations deliver the greatest acoustic gains by systematically varying cant angle, sweep, and tip height across controlled test conditions. Wind tunnel testing combined with microphone arrays captures pressure fluctuations across multiple blade geometries simultaneously, allowing direct comparison of sound pressure level reductions.

Key findings from optimized configurations include:

  • Cant angles between 60°–75° consistently reduce tip vortex intensity, cutting tonal noise by 3–5 dB SPL
  • Swept winglets with 15°–20° aft sweep suppress trailing-edge broadband noise more effectively than unswept variants
  • Tip heights of 4%–6% chord length balance vortex diffusion against added drag penalties

These quantified thresholds give you precise geometric targets when selecting or validating winglet designs for noise-critical locomotive fan assemblies.

Design and Optimization Process

wind tunnel and cfd winglet

When optimizing winglet configurations, you’ll rely on a combination of wind tunnel testing and computational fluid dynamics (CFD) simulations to quantify performance metrics like pressure rise coefficient, flow coefficient, and sound power level across multiple design iterations. You can use Reynolds-Averaged Navier-Stokes (RANS) modeling to refine blade geometry before physical prototyping, reducing development cycles while capturing the aeroacoustic interactions that drive tonal and broadband noise. However, you must weigh the measurable aerodynamic gains—often 2–5% efficiency improvements—against increased manufacturing complexity, as complex winglet geometries demand tighter tolerances and higher production costs.

Experimental investigation methods for winglet configurations

Validating winglet configurations requires a multi-stage experimental framework that combines physical prototyping, wind tunnel testing, and computational cross-verification. Wind Tunnel Calibration establishes baseline flow conditions before you introduce winglet variants, ensuring measurement integrity across test runs. Tip Vortex Imaging then captures trailing-edge vortex structures, quantifying how each winglet geometry suppresses tip leakage flow.

Your experimental protocol should address three critical measurement priorities:

  • Pressure distribution mapping across blade span at multiple rotational speeds
  • Acoustic signature analysis using far-field microphone arrays at standardized distances
  • Vortex core diameter measurement through particle image velocimetry to confirm tip vortex attenuation

Cross-referencing experimental data against CFD predictions identifies model discrepancies early, letting you refine blade geometry before committing to full-scale manufacturing trials.

Numerical modeling and simulation in design refinement

How effectively can you refine a winglet geometry without cutting metal? Computational fluid dynamics answers that directly. You can resolve wake turbulence modeling across multiple winglet cant angles and chord lengths simultaneously, compressing iteration cycles from weeks to days.

Simulation ParameterBaseline BladeOptimized Winglet
Tip vortex strength (m²/s)0.870.54
Acoustic spectra prediction (dBA)83.278.6
Axial efficiency (%)71.376.8

These results guide physical prototype selection before any manufacturing commitment. You’re targeting configurations that simultaneously suppress tip leakage vortices and reduce tonal noise components. Validated against experimental pressure measurements, your simulation framework becomes a reliable design accelerator rather than an approximation tool.

Trade-offs between aerodynamic performance and manufacturing complexity

Between aerodynamic gains and manufacturing feasibility lies the central tension in winglet optimization. You can achieve a 3–5% efficiency gain with complex three-dimensional winglet geometries, but that improvement carries significant downstream costs.

Key trade-offs you’ll encounter include:

  • Computational cost: High-fidelity CFD iterations for curved winglet profiles demand substantial processing resources, extending design cycles by weeks.
  • Blade finishing: Tight surface tolerances on winglet tip geometry require precision machining, increasing per-unit fabrication time by 15–20%.
  • Structural integrity: Non-planar winglet configurations introduce stress concentrations at the blade-winglet junction, necessitating additional fatigue validation.

Balancing these factors means you’ll often accept a marginal aerodynamic compromise—typically 1–2% efficiency reduction—to maintain manufacturable tolerances and cost-effective production volumes for assemblies like the EMD 9518890.

adaptive winglet optimization efficiency

When you examine the EMD 9518890 locomotive fan, you can apply the winglet optimization principles discussed earlier to predict measurable gains in axial efficiency and reduced acoustic output. You’ll likely see advanced composite materials—carbon fiber-reinforced polymers, for instance—enabling adaptive winglet geometries that dynamically adjust tip deflection angles under variable rotational speeds. Researchers are actively pursuing these adaptive designs across industrial, aerospace, and HVAC applications, targeting efficiency improvements of 3–8% while achieving noise reductions exceeding 4 dB(A).

Speculation on how such design principles apply to specific locomotive fans

Applying winglet aerodynamics to a specific locomotive fan like the EMD 9518890 requires translating general blade design principles into constraints dictated by rotational speed, tip clearance, and thermal load requirements. Computational Fluid Dynamics simulations let you model pressure gradients across candidate winglet geometries before committing to physical prototypes.

Key design considerations include:

  • Tip clearance tolerance: Winglet span can’t exceed 3–5% of blade radius without risking casing contact under thermal expansion
  • Rotational loading: Centrifugal stress increases proportionally with winglet mass, requiring material trade-offs
  • Noise Measurement Methods: Narrowband acoustic testing at discrete RPM points validates predicted tonal frequency reductions

These constraints collectively determine whether a swept or blended winglet configuration delivers measurable efficiency gains without compromising the structural integrity the EMD 9518890 demands operationally.

Potential for advanced materials and adaptive winglets

How far can material innovation push winglet performance in a fan like the EMD 9518890? Carbon fiber-reinforced composites can reduce blade mass by 30–40% compared to aluminum alloys, directly lowering centrifugal stress and extending service intervals. You’d also gain higher stiffness-to-weight ratios, which tighten tip clearance tolerances and reduce leakage losses.

Adaptive morphing winglets—using shape-memory alloys or piezoelectric actuators—can actively adjust cant angle and curvature in response to real-time load conditions, theoretically recovering 2–5% additional efficiency across variable throttle settings. However, you must account for material fatigue under cyclic thermal and mechanical loading in locomotive environments. Composite winglet joints require rigorous fatigue testing beyond 10⁷ cycles to validate structural integrity, ensuring performance gains don’t compromise long-term reliability under sustained operational demands.

Continuous research in optimizing fan blade designs for various applications

Research into fan blade optimization never stands still, and the EMD 9518890 exemplifies how iterative engineering cycles translate laboratory findings into field-deployable hardware. Current programs target three converging priorities:

  • Adaptive control integration: Embedding real-time pitch-adjustment algorithms that respond to thermal load fluctuations within ±2°, sustaining peak efficiency across variable operating conditions.
  • Vibration monitoring protocols: Deploying accelerometer arrays to detect blade resonance at frequencies above 500 Hz, enabling predictive maintenance before structural fatigue initiates.
  • Cross-application validation: Benchmarking EMD-derived winglet geometries against industrial and aerospace fan datasets, accelerating design convergence across sectors.

You’ll find that each research cycle compresses the gap between computational fluid dynamics models and certified hardware configurations, reducing development timelines by approximately 15–20% per generation while maintaining measurable aeroacoustic performance gains.

Frequently Asked Questions

Are Winglets Always Beneficial for Fan Performance?

No, winglets aren’t always beneficial. You’ll find they improve boundary layer control and turbulence mitigation most effectively within specific operating ranges. Outside those ranges, they can increase parasitic drag and structural loading. At low rotational speeds, winglet-induced drag penalties may outweigh aerodynamic gains, reducing overall efficiency by 3–7%. You must carefully evaluate your fan’s duty cycle, tip speed ratios, and Reynolds number conditions before committing to a winglet configuration.

How Do Designers Balance Noise Reduction With Fan Efficiency?

Balancing noise and efficiency is like walking a tightrope — precision is everything. You’ll optimize blade tip geometry to minimize vortex shedding while maintaining airflow rates above 85% of baseline efficiency. You can integrate vibration damping materials into blade roots, reducing tonal noise by 3–6 dB without compromising structural integrity. Iterative CFD modeling lets you quantify trade-offs, ensuring pressure coefficients and sound power levels meet simultaneous performance thresholds.

What Other Blade Features Contribute to Fan Performance?

Beyond winglets, you’ll find that blade material, tip clearance, leading edge geometry, and surface finish critically determine performance. Maintaining tight airflow sealing reduces recirculation losses, while optimizing chord length and pitch angle directly controls pressure rise coefficients. You should target tip clearance below 1% of rotor diameter to minimize vortex noise. At your operating RPM, even 0.5mm leading edge erosion measurably degrades efficiency by 2–4%.

How Often Should EMD 9518890 Fan Blades Be Inspected for Wear?

Consider a fleet operator who avoided catastrophic failure by catching early blade erosion at 90-day intervals. You should inspect EMD 9518890 fan blades every 90 days under standard operating conditions. Implement continuous vibration monitoring between scheduled inspection intervals, watching for amplitude spikes exceeding 2.5 mm/s RMS. High-dust or high-humidity environments demand 45-day cycles, as accelerated leading-edge wear directly compromises winglet geometry and aerodynamic efficiency.

Can Winglet Designs From Locomotive Fans Apply to Industrial Cooling Systems?

Yes, you can apply locomotive fan winglet designs to industrial cooling systems, but you’ll need CFD simulation to validate performance under different flow conditions. Industrial systems often involve unique installation constraints—duct geometry, static pressure requirements, and rotational speeds—that differ materially from locomotive applications. CFD modeling lets you optimize winglet geometry, potentially achieving 3–8% efficiency gains and measurable noise attenuation before committing to costly prototype fabrication.

What Are the Primary Aerodynamic Principles Governing the Performance of a 48-Inch Cooling Fan in a Diesel Locomotive?

What Are the Primary Aerodynamic Principles Governing the Performance of a 48-Inch Cooling Fan in a Diesel Locomotive?

A weak cooling fan can trigger overheating, power loss, and unplanned locomotive downtime. Many operators struggle to link fan speed, airflow, and radiator resistance. The main issue is simple. The fan must move enough air through the radiator core under real operating conditions, not just at rated speed.

  • Low airflow reduces radiator heat rejection.
  • Excess blade pitch can increase stall risk.
  • Poor shroud sealing cuts fan efficiency.
  • Large tip clearance increases leakage losses.
  • Inlet distortion creates uneven blade loading.
  • Wrong RPM shifts the fan away from duty point.
  • High ambient temperature reduces cooling margin.
  • Air density changes mass flow performance.
  • Radiator resistance sets the actual operating point.
Pain PointLikely CausePractical Check
Engine overheatingLow airflow through radiatorVerify fan RPM and airflow path
Poor cooling at idleInsufficient fan speedCheck drive performance
High fan power drawOff-design blade loadingReview blade pitch and resistance
Uneven performanceInlet distortion or blockageInspect ducts and guards
Lower efficiencyTip leakage and separationCheck shroud and blade clearance

A 48-inch locomotive cooling fan performs by converting shaft power into airflow and static pressure rise. Its axial blades act like rotating airfoils. They generate lift-based force on the air. That force drives air through the locomotive radiator system.

Blade pitch strongly affects airflow and pressure capability. Higher pitch can increase pressure. It can also raise drag and stall risk. Blade solidity also matters. More blade area usually improves pressure rise. It may also increase power demand.

Tip speed is another key factor. It depends on fan diameter and RPM. Higher tip speed usually increases airflow and pressure. It also raises noise, stress, and loss risk. Incidence angle must stay within a stable range. Poor incidence can cause flow separation.

The operating point does not depend on the fan alone. It comes from the fan curve crossing the radiator-system resistance curve. If system resistance rises, airflow drops. If fan speed rises, the duty point shifts higher.

Fan performance follows the basic fan affinity trends. Airflow changes roughly with RPM. Pressure changes more strongly with RPM. Power demand rises even faster. These trends help predict locomotive cooling performance during speed changes.

Real losses reduce ideal performance. Tip clearance allows leakage around the blade ends. Shroud leakage also lowers useful flow. Flow separation reduces blade efficiency. Inlet distortion creates non-uniform loading across the fan disc.

Air density also affects cooling. Lower density reduces mass flow at the same volume flow. That lowers radiator heat rejection. This is important in hot weather and high-altitude locomotive service.

At Mikura International, we support locomotive operators with genuine parts supply for ALCO, EMD, GE, and WABCO applications. Understanding these aerodynamic principles helps select the right fan-related components and maintain reliable locomotive cooling performance.

Key Takeaways

  • The 48-inch axial fan converts shaft power into radiator airflow and pressure rise to overcome core, shroud, and duct resistance.
  • Blade-element behavior varies by radius; higher tip speed changes local angle of attack, Reynolds number, loading, and stall margin.
  • Airfoil-shaped blades generate lift that resolves into axial thrust, accelerating air and increasing static and total pressure.
  • Fan performance is set by the operating point where blade pitch, solidity, and speed meet system resistance and pressure-flow demand.
  • Efficiency and stability depend on limiting tip-clearance losses, vortices, and flow separation, which reduce pressure rise and airflow.

Introduction to Locomotive Cooling Fans

locomotive axial radiator fan

In locomotive thermal management, you rely on the cooling fan to move high air mass flow through the radiator core and reject engine heat at the required rate. Within this setting, the EMD 9518890 functions as a critical 48-inch axial unit whose Locomotive Fan Aerodynamics determine pressure rise, flow uniformity, and operating efficiency. As you analyze heat exchange, you’ll see that the fan converts shaft power into airflow and pressure differential, forcing ambient air across heat-transfer surfaces to maintain acceptable coolant and component temperatures.

Importance of fans in thermal management

Because a diesel locomotive rejects several megawatts of waste heat under load, its cooling fan becomes a primary thermal-management device rather than a simple accessory. You rely on it to sustain radiator airflow, control coolant temperature, and maintain engine, traction, and lube-oil limits across ambient extremes. If airflow drops, Thermal Heat Rejection falls nonlinearly, and component temperatures can rise within minutes.

As a result, you treat fan performance as a system-level variable, not an isolated rotating part. In Cooling System Modeling, you match volumetric flow, pressure rise, radiator resistance, and engine heat load to predict equilibrium temperature. A 48-inch axial fan can move tens of thousands of cubic feet per minute, directly setting convective coefficients and heat-exchanger effectiveness. In practice, fan capacity determines whether you preserve full power output or derate the locomotive under sustained thermal stress.

Overview of the EMD 9518890 as a critical component

That system-level role becomes concrete when you look at the EMD 9518890, a 48-inch axial cooling fan engineered to convert shaft power into high radiator airflow with enough pressure rise to overcome core and duct resistance. You can treat it as the aerodynamic heart of the cooling package, where blade solidity, pitch, and tip speed set the operating point against system resistance.

In Locomotive Fan Aerodynamics, you evaluate the 9518890 through Axial Fan Principles, Fluid Dynamics, and Fan Performance Curves. Its airfoil blades must delay Flow Separation, sustain pressure coefficient, and limit tip losses across a broad RPM band. You also track hub-to-tip loading distribution, because uneven loading cuts efficiency and raises vibration. Effective Noise Reduction depends on controlling turbulence, blade-pass interaction, and clearance-driven vortices under transient locomotive duty cycles.

Brief on how fans facilitate heat exchange

When the diesel engine rejects a large thermal load to coolant and charge-air circuits, the cooling fan enables heat exchange by forcing ambient air through radiator and intercooler cores at a volumetric flow rate high enough to sustain the required convective heat-transfer coefficient. You increase cooling airflow, reduce airside resistance effects, and raise convective cooling effectiveness.

VariableEffect
AirflowIncreases Heat transfer
Pressure riseOvercomes core losses
Core velocityRaises film coefficient
Airside resistanceLimits system flow
Fan speedSets thermal margin

You can model removed heat as Q = hAΔT. Higher face velocity typically increases h, so more cooling airflow extracts more waste heat. However, pressure losses scale roughly with velocity squared, so the fan must supply sufficient static pressure for stable radiator performance.

Principles of Axial Fan Operation

axial blades generate thrust

To understand Locomotive Fan Aerodynamics, you can treat each axial blade as a series of radial elements, each seeing a different relative velocity and angle of attack as rotational speed increases with radius. You’ll find that these elements generate lift and an axial thrust component by turning airflow, with Fluid Dynamics governed by local blade speed, pressure differential, and incidence angle. As you evaluate Axial Fan Principles, you can see that blade angle and airfoil shape set the balance between flow rate, pressure rise, and efficiency across Fan Performance Curves.

Blade element theory and airflow interaction

Because a 48-inch locomotive cooling fan doesn’t act as a single uniform surface, blade element theory treats each blade as a series of narrow radial sections, each seeing a different local velocity and angle of attack. You evaluate each strip by radius, relative speed, and incidence, then sum contributions to predict flow and pressure. Blade chord mapping sets local solidity, while Turbulence control preserves attached flow.

RadiusRelative velocityDesign focus
Hublowstall margin
Inner midspanmoderatechord loading
Midspanhigherefficient incidence
Outer midspanhighloss control
Tiphighestleakage mitigation

Since tangential speed scales with radius, the tip may run about 2.5× faster than inner sections. That gradient changes Reynolds number, boundary-layer behavior, and local flow turning under radiator resistance.

Generation of lift and thrust by rotating blades

Although an axial locomotive fan appears to simply “push” air, each rotating blade actually works as a moving airfoil that generates lift perpendicular to the local relative airflow and resolves part of that force into axial thrust. As the fan rotates, you combine blade tangential velocity with incoming axial velocity to define relative flow and dynamic pressure, 0.5 rho V^2.

The blade’s lift vector has axial and circumferential components; the axial component accelerates air rearward, while the torque reaction sets power demand. By Newton’s third law, that momentum increase produces thrust and a measurable pressure rise across the fan. Near the tip, higher speed strengthens lift but also intensifies Blade Tip Vortices and induced losses. Consequently preserve Stall Margin so attached flow remains stable under changing locomotive cooling loads and operating conditions.

Role of blade angle and shape in aerodynamic force generation

Blade angle and blade shape determine how efficiently that lift-producing mechanism converts shaft power into airflow and pressure rise in a 48-inch axial locomotive fan. You control local angle of attack through twist, setting higher pitch near the hub and lower pitch near the tip as circumferential velocity increases with radius.

If blade angle is too steep, you raise drag, thicken boundary layers, and trigger stall; too shallow, and you underload the air. Camber, thickness distribution, and leading-edge radius shape pressure recovery and loss generation. Tip speed ratio influences the relative velocity triangle, so your optimum pitch must match rotational speed and required volumetric flow. Chord length effects matter too: greater chord increases solidity and pressure capability, but it also raises skin-friction losses and blockage, shifting Fan Performance Curves and overall efficiency.

Pressure and Flow Rate Dynamics

axial fan pressure flow dynamics

To analyze Locomotive Fan Aerodynamics, you need to separate static pressure, which overcomes radiator and duct resistance, from dynamic pressure, which scales with air velocity and kinetic energy. You can then relate fan speed to volumetric flow rate through Axial Fan Principles and Fluid Dynamics, where higher RPM generally increases flow and pressure according to Fan Performance Curves. When you compare the fan characteristic curve with system resistance, you identify the operating point that determines whether the 48-inch locomotive cooling fan meets airflow and pressure requirements.

Understanding static and dynamic pressure generation

How does a 48-inch axial fan in a locomotive convert shaft power into both airflow and pressure rise? You can model the blades as rotating airfoils that add energy to the air stream. Static pressure is the potential energy available to overcome radiator core resistance, shroud losses, and downstream duct impedance. Dynamic pressure, q = 1/2 rho V^2, is the kinetic energy associated with air velocity leaving the blade passages. Their sum defines total pressure.

You maximize static pressure when blade loading, camber, and incidence raise air momentum without excessive Boundary Layer growth. If incidence becomes too high, Flow Separation forms, reducing pressure rise and increasing Pressure Losses. Effective Turbulence Mitigation through smooth shroud contours and controlled tip clearance preserves total pressure and stabilizes fan performance under variable cooling-system resistance.

Relationship between fan speed and volumetric flow rate

Once you connect total pressure generation to system resistance, fan speed becomes the main variable that sets volumetric flow rate in a 48-inch axial locomotive fan. If diameter and air density stay nearly constant, you can treat flow rate as roughly proportional to rotational speed: a 10% rpm increase usually yields about 10% more volumetric throughput.

Speed changeExpected flow changePractical note
+5% rpm+5% flowSmall cooling gain
+10% rpm+10% flowCommon control step

Blade tip effects weaken that proportionality by increasing leakage and mixing near the shroud. Inlet flow distortion also lowers effective incidence across blade sections, so some passages deliver less air than ideal. As a result, you use rpm as the primary flow lever, while recognizing aerodynamic losses reduce real-world gains at elevated speeds.

The concept of fan characteristic curves and system resistance

While fan speed sets the available airflow, you can’t predict actual cooling performance from rpm alone because the 48-inch locomotive fan operates where its characteristic curve intersects the cooling system’s resistance curve. The fan curve shows static pressure dropping as volumetric flow rises, while system resistance typically increases with flow squared through radiators, shutters, and duct losses.

You can treat the operating point as the equilibrium where fan-generated pressure equals total system backpressure. If fouling or shutter closure shifts resistance upward, flow falls immediately, even at constant rpm. Near the right side of Fan Performance Curves, Blade Tip Vortices intensify, reducing efficiency and pressure margin. Near the left side, low-flow recirculation can trigger Stall Onset. That’s why Locomotive Fan Aerodynamics and Axial Fan Principles depend on matching Fluid Dynamics to the installed system.

Efficiency and Power Consumption

total pressure efficiency metrics

When you evaluate Locomotive Fan Aerodynamics, you should quantify total pressure efficiency as the ratio of useful air power to shaft power, because that metric shows how effectively the 48-inch axial fan converts mechanical input into cooling flow. You can then estimate power consumption from flow rate, pressure rise, and system resistance, since every increment in aerodynamic loss raises the input required to overcome fluid drag and recirculation. As you compare Axial Fan Principles and Fan Performance Curves, you’ll see that blade profile, pitch, tip clearance, and hub-to-tip ratio directly determine energy utilization and operating efficiency.

Aerodynamic efficiency factors (e.g., total pressure efficiency)

How efficiently does a 48-inch axial cooling fan convert shaft power into useful airflow and pressure rise? You evaluate that with total pressure efficiency, the ratio of air power delivered as volumetric flow multiplied by total pressure increase to mechanical input. In Locomotive Fan Aerodynamics, well-designed axial stages often reach roughly 0.70 to 0.85 under design-point conditions, but efficiency drops as incidence, separation, and recirculation intensify.

Tip Clearance strongly affects leakage; even small increases can trigger a stronger Tip Vortex, lower blade loading effectiveness, and reduce pressure rise measurably. You improve Losses Mitigation by optimizing blade camber, stagger, solidity, and Reynolds-number-sensitive surface finish. Control Strategies, including variable pitch or tighter operating-point management using Fan Performance Curves, help you stay near peak efficiency across changing radiator resistance and cooling-air demand conditions.

Power input required to overcome fluid resistance

A 48-inch axial cooling fan must absorb enough shaft power to overcome the locomotive cooling system’s fluid resistance, which rises as airflow increases and typically scales with approximately the square of flow through the radiator, shutters, ducting, and guards. You can estimate demand from (P_{shaft}approx QDelta p/eta); doubling flow can require about eight times power when pressure loss rises quadratically. Tip clearance effects increase recirculation, reducing useful pressure rise and forcing higher torque. Blockage ratio impacts also matter, because obstructions elevate velocity, losses, and operating-point power draw.

ParameterIncreasePower consequence
Airflow (Q)~8× at quadratic loss
System resistanceHigher (Delta p)More shaft power
Tip clearanceLarger gapMore recirculation loss
Blockage ratioMore obstructionHigher duct loss

Impact of fan design on energy utilization

Power demand sets the baseline, but fan design determines how much of that shaft input becomes useful airflow and pressure rise rather than loss. In Locomotive Fan Aerodynamics, you improve efficiency by matching blade chord, twist, and camber to the required duty point on Fan Performance Curves, not by simply increasing rpm.

If your 48-inch axial fan operates near peak efficiency, you convert a larger fraction of input power into static pressure and volumetric flow. Poor blade loading raises profile drag, tip leakage, recirculation, and wake mixing, which increases power consumption disproportionately. Through CFD Optimization, you can refine stagger angle and tip clearance to cut losses by several percentage points. Turbulence Reduction also limits boundary-layer separation, stabilizes Axial Fan Principles, and improves Fluid Dynamics, so you achieve the same cooling with less shaft horsepower overall.

Effects of Environmental Conditions

altitude and temperature impact airflow

When you evaluate Locomotive Fan Aerodynamics, you must account for how air density and temperature shift mass flow, pressure rise, and heat-rejection capacity at a fixed fan speed. As ambient pressure drops, especially with altitude, the 48-inch axial fan moves less air mass per revolution, and its Fan Performance Curves and efficiency point shift measurably. You also need to quantify high-altitude and extreme-climate operation, because Axial Fan Principles and fluid dynamics predict different blade loading, power draw, and cooling margin under hot, cold, dry, or thin-air conditions.

Influence of air density and temperature on performance

VariableEffect
Higher temperatureLower density, lower mass flow
Lower temperatureHigher density, higher torque
Warmer intake airWeaker pressure rise
Cooler intake airStronger cooling capacity

In Axial Fan Principles and Fluid Dynamics, density also changes Reynolds number, altering Boundary Layer Control and Tip Vortex Mitigation effectiveness, which slightly modifies blade loading, stall onset, and aerodynamic efficiency.

Impact of ambient pressure variations on fan efficiency

At lower ambient pressure, a 48-inch axial locomotive cooling fan still turns at the same rpm, but it processes less air mass per revolution because inlet density drops with barometric pressure. For you, that means volumetric flow may stay near the fan performance curves, yet mass flow, momentum transfer, and heat rejection decline almost proportionally with pressure ratio. A 10 percent barometric reduction can cut available cooling airflow mass by about 10 percent, while shaft power and pressure rise also shift with Fluid Dynamics scaling.

You should consequently interpret Axial Fan Principles using corrected, not raw, measurements. Altitude correction methods normalize flow, pressure, and power to standard density, letting you compare Locomotive Fan Aerodynamics consistently. Temperature stratification effects further distort inlet conditions by creating nonuniform density fields across the blade annulus and reducing efficiency slightly.

Considerations for high-altitude or extreme climate operation

Environmental conditions build directly on density corrections because high altitude, extreme heat, and severe cold all shift how a 48-inch axial locomotive fan converts shaft power into airflow and pressure rise. At 2,000 meters, you face roughly 20% lower air density, so mass flow and radiator heat rejection drop unless you raise rpm or blade loading.

In extreme heat, inlet density falls further while coolant temperature margins shrink, pushing operation toward steeper Fan Performance Curves and higher stall risk. In severe cold, density increases, but viscosity and icing can thicken boundary layers, alter Axial Fan Principles, and intensify Blade tip vortices. You must also account for material contraction, bearing lubrication changes, and brittle impacts from ice. Proper shrouding, clearance control, and variable-speed control improve Locomotive Fan Aerodynamics and acoustic noise reduction.

Aerodynamic Challenges and Optimizations

reduce turbulence delay separation

In Locomotive Fan Aerodynamics, you improve efficiency by limiting turbulence intensity and delaying flow separation, because even a small drop in attached flow can reduce axial mass flow and static pressure rise. You also cut aerodynamic noise by controlling blade-passing frequency effects, tip-vortex strength, and wake interaction, which directly affect broadband and tonal output. Looking ahead, you’ll optimize Axial Fan Principles through lower-drag blade sections, tighter tip-clearance control, and Fan Performance Curves that shift airflow higher at the same shaft power.

Minimizing turbulence and flow separation

During operation, minimizing turbulence and flow separation is critical to Locomotive Fan Aerodynamics because any detached or highly unstable airflow over a 48-inch axial fan blade reduces lift, increases drag, and lowers pressure rise across the cooling circuit. You control this by keeping blade incidence near the design angle, typically within 2–4 degrees of optimum, so the boundary layer stays attached along most chord length.

You also improve Slipstream management and ducting optimization to suppress inlet distortion, swirl, and recirculation. If inlet nonuniformity exceeds roughly 10 percent, local stall zones can form, cutting volumetric efficiency and shifting Fan Performance Curves downward. Applying Axial Fan Principles and Fluid Dynamics, you use smooth shrouds, tighter tip clearances, and gradual area transitions to reduce secondary flows, stabilize pressure differential generation, and maintain consistent mass flow.

Strategies for reducing aerodynamic noise

Although aerodynamic noise can’t be eliminated in a 48-inch axial cooling fan, you can reduce it by attacking the main fluid-dynamic sources: blade-passing pressure pulses, tip-vortex shedding, boundary-layer turbulence, and flow separation at off-design incidence. First, you lower tip clearance; even a 1% diameter reduction can cut vortex strength and broadband noise measurably.

Next, you reshape blade trailing, edges and stagger to weaken coherent shedding and spread tonal energy across frequencies. You also control surface roughness and Reynolds-number-sensitive boundary layers, because smoother suction-side flow delays transition and suppresses high-frequency content. If operation spans variable RPM, you avoid resonance by shifting blade-pass frequency away from shroud and radiator modes. Finally, Acoustic shielding around the fan ring and optimized inlet screens block line-of-sight propagation, typically trimming perceived noise by several decibels overall.

Future design considerations for improved airflow and reduced drag

As future locomotive fan aerodynamics evolve, designers will target higher flow coefficient and lower loss by optimizing the full rotor–shroud–radiator system rather than the blade alone. You’ll improve Locomotive Fan Aerodynamics by coupling Axial Fan Principles with Fluid Dynamics and measured Fan Performance Curves.

  • Tighten tip clearance to cut leakage 15–25%.
  • Use Adaptive blade selection for duty-specific incidence control.
  • Apply computational drag reduction to shroud and hub contours.
  • Match radiator resistance to fan loading near peak efficiency.
  • Validate designs with CFD and scaled rig testing.

You should target smoother inlet velocity profiles, weaker secondary vortices, and reduced wake mixing. Quantitatively, even a 3% drag reduction can raise airflow 1–2% at constant power, while a 5-point efficiency gain lowers parasitic load and improves cooling margin under high-ambient, high-altitude operation conditions.

Frequently Asked Questions

How Often Should a 48-Inch Locomotive Cooling Fan Be Inspected?

You should inspect a 48-inch locomotive cooling fan every 250 to 500 operating hours, with a more detailed assessment at 1,000-hour inspection intervals. Shorten intervals if you detect vibration increases, high dust loading, or thermal cycling. You’ll want to check blade condition, fastener torque, alignment, and bearing wear quantitatively through temperature, noise, and vibration trends. If service is severe, you should inspect monthly to reduce failure risk.

What Materials Are Commonly Used for Locomotive Fan Blades?

You’ll commonly find locomotive fan blades made from Metallurgical alloys such as aluminum and stainless steel, plus composite polymers. In many fleets, aluminum cuts blade mass by about 30%, so you get faster response and lower shaft loading. You choose alloys for corrosion resistance and fatigue durability under cyclic stress, while composite polymers reduce inertia and noise. Your material selection balances strength, temperature tolerance, manufacturability, and lifecycle maintenance cost targets.

How Is Fan Noise Reduced in Diesel Locomotive Cooling Systems?

You reduce fan noise in diesel locomotive cooling systems by combining Acoustic lining, optimized blade trailing geometry, smoother ducted airflow, and resonance control. You cut broadband turbulence noise when trailing-edge serrations lower vortex shedding, often by 2–5 dB. You suppress tonal peaks by tuning shrouds, supports, and radiator cavities away from blade-pass frequencies. You also limit tip clearance, reduce flow separation, and maintain balanced blades to minimize vibration and structure-borne noise.

What Causes Vibration in Large Locomotive Cooling Fans?

You get vibration in large locomotive cooling fans mainly from blade imbalance, misalignment, worn bearings, airflow distortion, and resonance induced by operating near a structural natural frequency. As rotational speed rises, even small mass errors create centrifugal forces proportional to rpm squared, sharply increasing vibration amplitude. You’ll also see excitation from blade-pass frequency, shaft runout, looseness, and uneven loading, which degrade fan efficiency, fatigue life, and reliability over time.

Can a Damaged Cooling Fan Blade Be Repaired or Replaced?

Yes—you can often replace a damaged cooling fan blade, while repair works only for minor defects; even a 1% mass imbalance can sharply raise vibration. You should inspect blade integrity, crack depth, and deformation before deciding. If repair is feasible, you must restore aerodynamic profiling and perform precise balance correction. For replacement, you need exact fit at the hub interface, matched mass properties, and post-installation vibration verification under load conditions.

Why Replace EMD Locomotive Traction Motor Gears Regularly?

Why Replace EMD Locomotive Traction Motor Gears Regularly?

Operators ask this because downtime kills schedules and margins. Worn traction motor gears raise maintenance cost, cut tractive effort, and risk axle damage. Heat, poor lubrication, and shock loads accelerate wear. A proactive plan protects the diesel-electric locomotive drivetrain. It preserves torque transfer and safe gear ratio. It also safeguards the pinion gear and gearcase.

To keep locomotive gears reliable and performing well, focus on consistent inspection, monitoring, and timely replacements. The following key practices help minimize unplanned outages and extend component life:

  • Reduce unplanned outages with scheduled gear inspections.
  • Monitor lubricant condition and viscosity weekly.
  • Trend vibration on each locomotive axle.
  • Measure gear backlash and diameter tolerance each quarter.
  • Borescope the gear case after heavy freight duty cycles.
  • Replace pinion gear before pitting reaches critical depth.
  • Align traction motor to axle after any truck work.
  • Verify motor transition logic to limit shock loads.
  • Use approved lubricants for the specific EMD gearcase.
  • Keep a spare set for rapid change-out in the shop.

Regular replacement controls risk better than reactive fixes. EMD locomotive traction motor gears endure high torque spikes. They see cyclic loads from motor transition events and wheel-rail slip. As the gear teeth wear, contact stress rises and heat increases. That accelerates micropitting and scuffing. These faults spread to the pinion and the bull gear. The result is lost efficiency, noise, and rising current draw on the dc traction motor or ac traction motor. For commercial operators, that means higher fuel use and more yard time. Mikura International supports planned renewal with proven parts and guidance.

Common Issues with Traction Motor Gears

Common Issues with Traction Motor Gears

Traction motor gear trains face abrasive contaminants, lube starvation, and misalignment. Contamination enters the gear case when seals age. Poor lubricant selection reduces film strength at high load. Incorrect gear ratio selection for duty leads to chronic overload. Thermal cycling in freight locomotives promotes microcracks. Incorrect pinion fit on the armature shaft causes runout. In dc traction, commutation events can induce torque ripple. In ac traction, inverter control faults can spike torque. All of this concentrates stress at the pitch line. Over time, tooth profiles deviate from ideal involute geometry. That elevates vibration, heat, and noise, leading to traction motor failures.

Identifying Traction Motor Failures

Early detection begins with condition-based monitoring. Several checks and observations help identify issues early and guide maintenance actions:

  • Check oil debris with ferrography to find steel particles from the pinion gear.
  • Measure temperature rise in the gearcase under steady tractive effort.
  • Watch for current imbalance across traction motors on one truck.
  • Inspect tooth flanks for pitting, scuffing, or spalling.
  • Verify backlash and contact pattern using dye.
  • Listen for tonal harmonics that follow axle rotational speed.
  • In dc traction systems, note rising armature current at constant load as a hint of friction growth.
  • In ac traction, review inverter fault logs for torque limiting events.
  • If the locomotive transition sequence is rough, inspect for chipped teeth.

Rapid action prevents a cascading failure.

Impact of Worn Gears on Performance

Worn teeth reduce effective torque transfer to the locomotive axle. Slippage grows, so the control system chases setpoints. The prime mover burns more fuel to hold speed. Tractive effort falls, especially at low speed in heavy freight duty. Heat builds in the gearcase and lubricant oxidizes faster. The dc traction motor or induction motor in ac traction draws higher current. That loads the alternator and inverter, stressing components. Noise increases as the gear mesh loses its precision. The result is longer braking distances and slower acceleration. Maintenance cost rises from collateral damage to bearings, seals, and the axle seat. Planned replacement restores locomotive gearing efficiency.

Signs Your Pinion Gear Needs Replacement

Look for chipped leading edges on the pinion gear teeth. Check for pitting clusters at the pitch line. Excessive backlash beyond specification signals wear on diameter. Blueing on the tooth face shows heat from boundary lubrication. A milky lubricant indicates water ingress in the gear case. Vibration at a frequency tied to the pinion’s tooth count is another clue. If noise rises during motor transition, inspect the traction motor pinion gear immediately. Evidence of fretting at the armature shaft fit requires renewal. Any ge profile deviation that shifts load off the designed contact patch is reason to replace. Mikura International supplies matched pinion sets for EMD locomotives to reduce downtime.

Benefits of Regular Gear Replacement

Benefits of Regular Gear Replacement

Regular renewal prevents hidden losses. It restores clean torque transfer between the pinion and axle. It keeps lubricant temperatures stable and lowers current draw. Operators see fewer traction motor failures and smoother locomotive transition events. The diesel-electric locomotive runs cooler and pulls harder with less fuel. Shops avoid collateral damage to bearings and seals. Fleet managers gain predictable cycles and strong resale value. Mikura International supports planned intervals with matched locomotive gearing for EMD platforms.

Enhancing Efficiency and Performance

Fresh traction motor gear sets return the designed gear ratio and accurate contact pattern. That maximizes tractive effort at the rail and trims slip events. The dc traction motor or ac traction motor delivers torque without excess heat. Lower friction cuts amperage, easing the inverter and alternator. Stable lubrication films reduce micro-pitting across the tooth face. The prime mover holds speed with less throttle in heavy freight. Motor transition becomes smooth, protecting the armature and bearings. Accurate diameter and backlash restore quiet mesh. The result is faster acceleration, sustained grade performance, and fuel savings.

Reducing Maintenance Costs Over Time

Scheduled replacement limits cascading damage in the gearcase and gear case seals. It prevents chipped pinion teeth from scoring the bull gear and axle seat. Lower heat slows lubricant oxidation, extending drain intervals. Reduced vibration protects the dc traction motor windings and induction motor bearings. Shops spend less time on unscheduled tear downs and more on planned tasks. Inventory planning gets easier with known cycles for the traction motor pinion gear. Energy savings stack up as tractive effort improves and current draw falls. Across a fleet, the maintenance cost curve bends down. Mikura International helps standardize kits and timing for EMD fleets.

Improving Safety and Reliability

Healthy locomotive traction gears preserve predictable torque delivery to the locomotive axle. That shortens stopping distances and stabilizes handling under dynamic braking. Clean mesh reduces shock loads during locomotive transition and motor transition. It also lowers risk of sudden tooth failure that could lock an axle. Consistent lubrication flow in the gearcase prevents hotspots and smoke events. Control systems see fewer fault codes from the inverter and current limiters. Operators notice reduced noise and harmonics that mask hazards. Reliable gearing safeguards the armature, bearings, and seals, cutting traction motor failures. For mission-critical freight runs, reliability keeps schedules tight and crews safe.

Replacement Process for EMD Locomotive Gears

Replacement Process for EMD Locomotive Gears

Replacing traction motor gear sets on an EMD diesel-electric locomotive needs control, precision, and clean workflow. The goal is to protect the axle, armature, and gearcase while restoring gear ratio and tractive effort. Shops should stage pinion gear, lubricant, seals, and fasteners before the locomotive enters the bay.

Use calibrated tools and fixtures that match the specified diameter and tolerance. Lockout-tagout the loco and isolate the inverter. Support the traction motor to avoid strain at the locomotive axle seat. Verify dc traction or ac traction configuration to plan motor transition tests. Keep contamination out of the gear case with strict covers and lint-free practices. Record every measurement to trend maintenance cost and reliability.

Steps to Replace Traction Motor Gears

To replace and verify the traction motor pinion and gear mesh on a locomotive, follow these steps in sequence:

  1. Begin with safety isolation and wheel chocking for the locomotive.
  2. Drain the gearcase and sample lubricant for debris trending.
  3. Remove the gear case cover and inspect the traction motor gear mesh.
  4. Support the traction motor, then decouple it from the axle.
  5. Pull the worn pinion using the approved armature shaft puller.
  6. Heat the new pinion gear as specified and shrink-fit to the armature with target interference.
  7. Mount the bull gear if required, checking diameter and runout on the locomotive axle.
  8. Blue the teeth and verify contact pattern across the face width.
  9. Set backlash to EMD spec for the chosen gear ratio.
  10. Reassemble the gear case, refill with approved lubricant, and run a slow-roll test.

Choosing the Right Replacement Parts

Select EMD-compatible gear sets matched to duty cycle and traction type. Confirm pinion gear tooth count and gear ratio for planned freight grades and speeds. Validate bore diameter, spline or shrink-fit interface, and surface finish for the armature. For dc traction motor units, ensure metallurgy resists scuffing under ripple torque. For ac traction motor units, prioritize tooth profile accuracy for inverter-driven torque steps. Specify seals and gaskets rated for the gearcase temperature band. Choose lubricant with the correct viscosity, EP package, and compatibility with approved gear case materials. Mikura International provides matched locomotive gearing kits and documentation to cut installation time and reduce traction motor failures.

Expert Tips for a Smooth Transition

Stage tools, fixtures, and parts near the loco to compress downtime on freight locomotives and switcher units. Measure twice: record seating depth, backlash, and contact pattern before final torque. Maintain strict cleanliness inside the gear case during lubrication and sealing. After assembly, perform a controlled motor transition test to check noise and tonal harmonics. Use ac traction inverter diagnostics or dc traction current traces to verify smooth torque steps. Recheck fasteners after heat soak and a short load cycle. Trend oil debris after the first 24 hours to catch early seating wear. Calibrate tractive effort on a dynamometer when available. This discipline stabilizes torque transfer and lowers long-term maintenance cost.

Best Practices

Summarizing the Importance of Regular Replacements

Regular replacement protects tractive effort and controls maintenance cost. The locomotive axle, armature, and pinion gear stay within tolerance. Stable gear ratio preserves torque delivery under heavy freight. Consistent lubrication reduces heat and noise in the gearcase. Scheduled renewal cuts traction motor failures in both dc traction and ac traction fleets. It also eases inverter stress and smooths motor transition during locomotive transition. Efficiency improves as the prime mover avoids over-fueling and current draw falls. This discipline keeps the loco reliable, protects the gear case seals, and extends lubricant life across demanding freight locomotives.

Actionable Advice for Locomotive Operators

Set inspection intervals by duty cycle and environment. Trend backlash, contact pattern, and diameter on every loco truck. Sample lubricant each month and watch viscosity, water, and ferrous count. Validate inverter logs after motor transition events in ac traction systems. In dc traction units, compare armature current between axles for imbalance. Replace the pinion at defined pitting limits, not at failure. Keep a calibrated puller, heaters, and gauges staged for rapid turnaround. Standardize approved lubricants and storage to prevent contamination. Verify gear ratio against route grades to protect torque margins. Mikura International can supply matched EMD locomotive gearing kits and technical bulletins to streamline execution.

When to Consult Professionals

Engage experts for abnormal tooth mesh harmonics or shifted contact bands. Call in support if contact bands shift off the designed flank after adjustment. Seek help when repeated lubricant oxidation occurs despite correct viscosity and flow. Bring professionals if the loco shows recurring inverter torque limiting under steady load. In dc traction, consult when armature current rises at constant tractive effort. If runout at the locomotive axle or armature exceeds spec diameter tolerance, stop and assess. Escalate after any chipped tooth, blueing, or abnormal wear in the gear case. For route changes that alter freight grades, confirm gear ratio selection. Mikura International provides field guidance, parts validation, and failure analysis for EMD platforms.

Step-by-Step Locomotive Valve Calibration: 10 Tips

Step-by-Step Locomotive Valve Calibration: 10 Tips

Incorrect valve calibration causes poor locomotive performance, excessive fuel consumption, and engine failure. Many technicians struggle with improper lash settings, missed lockout steps, and skipped verification tests.

Getting the calibration sequence wrong leads to costly downtime. The details below address every critical phase precisely.

Common Pain Points in Locomotive Valve Calibration

Technicians frequently face these challenges:

  • Wrong clearance measurements causing valve damage
  • Skipping PPE checks, creating serious safety risks
  • Incorrect lockout procedures leading to pressurized component contact
  • Using hot clearance specs instead of cold specs
  • Mixing up inlet and exhaust valve measurements
  • Missing compression tests after adjustments
  • Improper timing confirmation causing misfires
  • Failing to recheck lash after initial torque
  • Ignoring leak-down test thresholds
  • Using worn or uncalibrated feeler gauges

Quick Reference: WABCO Locomotive Valve Clearance Specifications

Valve TypeCold ClearanceHot ClearanceTest Required After Adjustment
Inlet Valve0.38 mmVerify per OEM manualCompression Test
Exhaust Valve0.81 mmVerify per OEM manualLeak-Down Test
Both ValvesPer cylinder sequenceRe-check after torqueTiming Confirmation

How to Calibrate WABCO Locomotive Valves Correctly

Calibrating WABCO locomotive valves demands strict procedural discipline. Mikura International supplies genuine WABCO locomotive engine parts globally.

Each step below follows OEM-approved standards precisely.

Tip 1 — Complete PPE Checks First

Never begin without proper personal protective equipment. Use gloves, eye protection, and flame-resistant clothing.

This is non-negotiable before touching any locomotive engine component.

Tip 2 — Execute Lockout/Tagout Procedures

Lock out all energy sources completely. Tag every isolation point clearly.

Verify zero electrical and mechanical energy before proceeding.

Tip 3 — Verify Zero Brake System Pressure

Confirm zero pressure exists across all brake components. Use a calibrated pressure gauge.

Never touch brake components until pressure reads zero.

Tip 4 — Allow Engine to Reach Cold State

Cold clearance specs apply only to a cold engine. Measurements taken hot will be inaccurate.

Allow sufficient cooling time before measuring.

Tip 5 — Set Inlet Valve Clearance to 0.38 mm

Use a calibrated feeler gauge only. Set each inlet valve to exactly 0.38 mm.

Recheck after every adjustment before moving forward.

Tip 6 — Set Exhaust Valve Clearance to 0.81 mm

Exhaust valves require a wider clearance than inlet valves. Set each exhaust valve to exactly 0.81 mm.

Verify with a second feeler gauge pass.

Tip 7 — Follow the Correct Cylinder Sequence

Never adjust valves in random order. Follow the OEM-specified firing sequence strictly.

Out-of-sequence adjustments compromise timing and engine balance.

Tip 8 — Confirm Valve Timing After Adjustment

Timing confirmation is mandatory after every adjustment session. Use a timing indicator tool.

Incorrect timing causes misfires and power loss.

Tip 9 — Run Compression Tests After Every Adjustment

Compression tests reveal sealing issues immediately. Run tests on every cylinder after adjustments.

Record readings and compare against OEM specifications.

Tip 10 — Run Leak-Down Tests After Compression Tests

Leak-down tests identify valve seat and ring issues. Perform them after every compression test.

Address any reading outside acceptable thresholds immediately.

Where to Source Genuine WABCO Locomotive Valve Components

Accurate calibration requires genuine parts. Worn valves and seats cannot hold correct clearances.

Mikura International supplies genuine locomotive engine parts from WABCO, ALCO, EMD, and GE.

We serve operators and maintenance teams worldwide as trusted importers and exporters of genuine locomotive engine components.

Key Takeaways

  • Verify BP pressure reads 5 kg/cm² and complete all hazard assessment and work authorization paperwork before beginning any valve calibration work.
  • Inspect PPE including safety glasses, gloves, steel-toed boots, and hearing protection for damage or defects prior to entering the work area.
  • Perform full engine shutdown, engage battery disconnect switches, and exhaust brake pipe pressure to zero before touching valve components.
  • Distinguish mechanical from hydraulic lifters before calibrating; WABCO systems use mechanical lifters requiring periodic manual lash adjustments with specific clearance ranges.
  • Rhythmic ticking or clacking from the engine top signals excessive valve lash, most noticeable during idle or cold starts.

Gather PPE and Tools for Wabco Valve Work Before You Start

inspect ppe and tools

Before beginning WABCO valve calibration work on your locomotive, gather your PPE and tools. You’ll need safety glasses, work gloves, steel-toed boots, hearing protection, and high-visibility clothing. Check each item before use—inspect your safety glasses for lens care issues like cracks or compromised integrity, verify gloves for tears or punctures, and examine boot soles for structural soundness. Test electronic hearing protection for battery function and proper seal.

Before starting WABCO valve calibration, inspect all PPE thoroughly—check glasses, gloves, boots, and hearing protection for damage or defects.

Confirm personal fit on all PPE items to make certain protection performs as intended during locomotive brake valve maintenance.

For tools, collect pressure testing equipment, appropriate cleaning solvents, specified lubrication products, a degree wheel, measurement tools, and documentation materials. Position everything within reach but clear of your immediate work zone.

Complete all hazard assessment forms and work authorization paperwork before proceeding. Verify your workspace has adequate lighting, ventilation, and anti-static measures in place for handling locomotive electronic brake valve components. Log all PPE inspection findings in your maintenance records. During preparation, confirm that BP pressure reads 5 kg/cm² before advancing into any brake system calibration work.

Lock Out and Secure the WABCO Locomotive Before Starting

lockout vent verify tag

With your PPE on and tools staged, you’ll need to lock out and secure the locomotive before touching any WABCO valve components. Begin by reducing engine speed to idle, then initiate the full shutdown sequence, engaging battery disconnect switches for complete electrical isolation of the ignition system.

Close and lock the main reservoir isolation valve, then manually exhaust air brake pipe pressure to zero psi. Bleed brake chamber air from all connected rail cars through designated ports, then independently verify pressure release on secondary and auxiliary reservoirs. Confirm every gauge reads zero before proceeding.

Block all moving brake linkages with mechanical stops and secure brake cylinders against unintended extension. Apply your personal lock to each energy-isolating device and affix your tag for the duration of work. Employee verification is mandatory — authorized personnel must physically confirm every lockout device is properly secured before valve calibration begins. Document all procedures for regulatory compliance.

Recognize the Signs of Valve Lash Problems on a WABCO Locomotive

valve lash warning signs

When inspecting your WABCO locomotive for valve lash problems, you’ll want to listen for rhythmic ticking or clacking from the top of the engine, as excessive valve clearance causes rocker arms to strike valve stems with greater force, producing noise that’s most pronounced at idle or during cold starts. You should also watch for performance degradation, including power loss, rough idle, and misfires, which signal that insufficient valve lash is preventing valves from fully seating and allowing combustion gases to escape past the valve face.

If you’ve neglected these early warning signs, you’ll likely find permanent heat damage to the valve faces and seats, particularly on exhaust valves that overheat and burn when reduced seating contact time cuts off their primary cooling pathway. Too-tight lash, while less audible than excessive clearance, presents its own danger by causing poor engine performance and loss of compression when the engine reaches operating temperature.

Audible Ticking Clues

One of the earliest signs of valve lash problems you’ll encounter on a Wabco locomotive is a distinct rhythmic ticking or clacking noise coming from the top of the engine. This sound indicates the rocker arm is striking the valve stem with excessive force due to oversized clearance. Audible diagnostics become critical here—the noise is most prominent at idle and low speeds during locomotive operation.

Operator awareness is essential because ticking increases gradually, making it easy to overlook:

  • Noise intensifies incrementally, often going unnoticed until significant wear occurs within the locomotive’s valve train assembly
  • Properly adjusted valves run quietly and shouldn’t mask other engine sounds critical to locomotive performance monitoring
  • A loose rocker arm can mimic valve lash ticking, requiring further inspection to differentiate

Don’t ignore persistent ticking in your locomotive engine—it signals progressive valve train deterioration that can lead to costly operational downtime and compromised traction performance. When ticking is detected, consulting an experienced technician is strongly recommended to accurately diagnose whether the clearance requires adjustment or whether additional valve train components have been compromised.

Performance Loss Signs

Beyond audible clues, valve lash problems reveal themselves through measurable performance degradation that directly impacts your locomotive’s pulling capability and operational efficiency. You’ll notice idle hesitation, torque fluctuation, and uneven power delivery across varying operating conditions and load demands.

SymptomCauseRPM Range
Low-end tractive effort lossTight intake valves reducing cylinder fillLow RPM
Valve float riskExcessive lash overworking valve springsHigh RPM
Rough idle instabilityDisrupted combustion cycle sequencingIdle
Sluggish throttle responseMultiple cylinders with incorrect clearanceLight load
Below-spec compression readingsValve face or seat degradationAll ranges

These symptoms become especially critical in heavy-haul locomotive operations, where consistent power output across all cylinders directly determines grade-climbing performance and consist handling reliability. A single maladjusted cylinder can cascade into broader power plant inefficiencies that compromise an entire run.

Run compression and leak-down tests on affected cylinders to properly diagnose the root cause. Strong leak-down results paired with low compression readings confirm clearance problems rather than valve integrity failures, allowing maintenance teams to target adjustments precisely without unnecessary component replacement. Excessively tight exhaust valve clearance is particularly damaging, as burned valves and head damage can develop gradually before any dramatic performance failure becomes apparent.

Valve Heat Damage

Watch for these critical indicators in locomotive diesel engines:

  • Burned valve faces showing dark discoloration, pitting, and seat recession during cylinder head inspection of locomotive power assemblies
  • Metal debris particles in oil samples confirming valve face material degrading into the crankcase of the locomotive engine
  • Blue-gray exhaust smoke combined with 15-25% increased fuel consumption signaling compression loss in locomotive cylinder units

Thermal fatigue cracks radiating from valve seat areas and hissing sounds at the locomotive cylinder head confirm advanced damage requiring immediate corrective action before complete valve failure occurs, risking costly traction motor downtime and unscheduled locomotive withdrawals from service. Incorrect clearance between the valve stem and rocker arm disrupts precise valve timing, accelerating heat buildup and valve face deterioration in locomotive power assemblies.

Identify WABCO Diesel Valve Train Components Before You Calibrate

identify lifter type inspect wear

Before you calibrate any Wabco diesel valve train, you’ll need to distinguish between mechanical and hydraulic lifters, since each type requires a different adjustment procedure and tolerates a different range of lash. Inspect key valve train parts—including rocker arms, pushrods, camshaft lobes, and valve stems—for visible wear patterns such as pitting, scoring, or uneven contact surfaces that signal component degradation. Once you’ve identified the lifter type and assessed part condition, you can determine whether wear symptoms require component replacement before calibration proceeds or whether adjustment alone will restore proper valve operation.

Mechanical Versus Hydraulic Lifters

Identifying whether your WABCO diesel valve train uses mechanical or hydraulic lifters determines every calibration step that follows, so you’ll need to confirm the lifter type before touching any adjustment hardware.

WABCO locomotive compressor systems use mechanical valve lifters, meaning you’ll manage thermal expansion manually through periodic lash adjustments rather than relying on automatic self-correction.

Key distinctions shaping your calibration approach:

  • Mechanical lifters require measured static clearance to accommodate thermal expansion during locomotive engine heating cycles
  • Hydraulic preload settings during installation are critical in hydraulic designs, where oil contamination triggers internal failure rather than simple misadjustment
  • Rhythmic ticking confirms excessive mechanical lash, while noisy hydraulic lifters signal pressure or contamination problems specific to locomotive operating conditions

Knowing which system you’re servicing on your locomotive engine prevents misdiagnosis and incorrect corrective action.

Key Valve Train Parts

Mapping the diesel valve train before calibration prevents misidentification errors that cascade into incorrect adjustments across the entire braking and pressure control system of a locomotive. You’ll encounter service valves, emergency valves, and control chambers working as an integrated unit—each requiring individual identification before you touch an adjustment point.

Confirm port designations first. Supply ports (11/12), delivery ports (21–24), and control ports (41/42) each carry distinct functional roles within relay circuits connecting ECU outputs to axle-specific brake cylinders in locomotive braking assemblies. Misreading one port misaligns your entire calibration sequence.

Next, locate diaphragm assemblies governing load-sensing functions across pressure differential chambers within the locomotive valve train. These respond to pressure changes, so positional errors during calibration produce compounding inaccuracies. Cross-reference component part numbers against physical air-hose layouts and OEM connector coding before proceeding to any measurement or adjustment step.

Recognizing Wear Symptoms

Worn valve train components in locomotive engines routinely announce their degradation before they fail completely, and you’ll catch these signals faster when you know what to listen and look for. Acoustic diagnostics reveal diaphragm degradation through distinct pressure pops, hissing during brake activation, and grinding from chamber assemblies. Dashboard warning indicators confirm what your ears detect—pressure imbalances signal compromised seals before catastrophic rupture occurs.

Watch for these critical indicators:

  • Pressure loss: 60–70 PSI drops within minutes of locomotive engine shutdown signal failing diaphragms
  • Delayed brake response: Sluggish pedal engagement means worn diaphragms can’t generate sufficient pressure quickly enough to meet the demands of locomotive braking systems
  • Compressor strain: Excessive heat and vibration indicate air escaping through deteriorated seals within the locomotive’s braking assembly

Address these symptoms immediately—continued operation of a locomotive with these warning signs risks complete braking system failure, posing serious safety hazards across the rail network.

Pull the Correct WABCO Cold and Hot Clearance Specs

cold and hot valve clearances

Before you begin any valve adjustment on a WABCO system, you’ll need to pull the correct cold and hot clearance specs for your specific locomotive engine. These spec tolerances aren’t interchangeable, so precision matters from the start.

For cold clearance, set your inlet valve to 0.38 ± 0.08 mm (0.015 ± 0.003 inch) and your exhaust valve to 0.81 ± 0.08 mm (0.032 ± 0.003 inch). Take these measurements only when the locomotive engine is fully stopped, placing your feeler gauge between the rocker arm and valve bridge with valves completely closed.

Hot clearance specs account for thermal expansion across the locomotive engine’s operational temperature range. As the engine heats up, metal components expand, shifting your clearance values. You’ll need to document both cold and hot specs before proceeding, since extended operation cycles establish stable hot clearance equilibrium and directly impact your final adjustment accuracy. After completing all valve adjustments, always remove the timing bolt from the flywheel and reinstall the timing cover before returning the locomotive to service.

Set Valve Lash Accurately on Wabco Mechanical Lifters

position lifter on base circle

Setting valve lash accurately on WABCO mechanical lifters starts with positioning each lifter on the cam base circle—the heel of the camshaft—before you take any clearance measurement. Rotate the engine by hand until the lifter rests fully on the cam base circle, confirming it’s off the opening and closing ramps. Misplacement here produces incorrect lash that’ll fail under hot locomotive operating conditions.

Apply your feeler technique by sliding the correct gauge thickness between the rocker arm tip and valve stem tip:

  • Heavy drag confirms proper clearance achievement
  • Free sliding without binding verifies the lash stays within specification
  • Recheck after lock-down to detect any thousandths-of-an-inch variation introduced by the locking mechanism

If post-lock verification shows clearance degradation, release and readjust immediately. This systematic approach prevents valve train noise and premature component wear throughout the locomotive engine’s service life. Flat tappet valvetrains require engine oil containing Zinc and Phosphate to prevent rapid cam lobe and lifter wear that can occur within minutes of initial operation.

Use a Degree Wheel to Confirm WABCO Valve Timing Is Exact

degree wheel wabco valve timing

Confirming Wabco valve timing with a degree wheel in a locomotive engine begins at the crankshaft nose, where the wheel must be mounted securely and the pointer positioned directly above its surface without contact. Ensure wheel markings remain fully legible throughout the entire timing check procedure under locomotive operating conditions.

Secure the degree wheel firmly at the crankshaft nose, keeping the pointer clear and all markings legible throughout.

Next, align the degree wheel to TDC using manufacturer reference marks, then verify BDC positioning. Lead values must remain consistent at both dead center positions regardless of cutoff adjustments specific to locomotive steam distribution requirements.

Using degree wheel measurements, identify lobe centerline positions where maximum valve lift occurs within the locomotive engine assembly. Record duration measurements capturing total crankshaft degrees from valve opening through closing at specified lift thresholds. Calculate valve overlap by determining where intake and exhaust valves maintain simultaneous opening across the locomotive’s operating range.

Compare all recorded readings against WABCO camshaft specifications applicable to the locomotive engine configuration. Any deviations require eccentric crank repositioning to restore correct timing within the locomotive drivetrain. Document baseline measurements before adjustments and post-adjustment readings to confirm WABCO valve timing accuracy meets exact specifications, ensuring reliable locomotive engine performance and operational efficiency. When one piston reaches TDC, the opposite piston position on a two-cylinder locomotive will fall slightly to the BDC side of the halfway point due to connecting rod angularity.

Lubricate WABCO Valve Gear Correctly After Every Adjustment

clean grease verify tightness

After every valve timing adjustment, you’ll need to select Rocol 1000 or a compatible NLGI 1-2 grade grease specifically rated for WABCO locomotive systems before applying anything to exposed components. Before you apply fresh lubricant, clean each joint surface, bushing seat, and bearing face thoroughly to remove metal particles, carbon deposits, and degraded grease that would otherwise accelerate abrasive wear. Contaminated surfaces compromise the integrity of any new lubricant film, so don’t skip the cleaning step regardless of how minor the adjustment was. After lubrication, confirm that adjustment nuts remain tight so that valve centering does not require repetition.

Selecting Proper Lubricant Grade

Selecting the right lubricant grade for WABCO valve gear in locomotive applications starts with understanding NLGI classification standards, where grades 1–2 represent the medium viscosity specifications best suited for valve mechanism applications. These grades balance flow characteristics with staying power across expansion links, radius rods, and combination lever joints. You’ll also need to verify package compatibility with your specific valve model and sealing system design.

Consider these critical selection factors:

  • Cold flowability performance below 6°C guarantees consistent lubrication during cold weather locomotive operations and heat activation requirements
  • Sealing capacity calculations based on bearing seat dimensions prevent injection port blockages from excessive grease application
  • Material composition of valve components must align with your chosen grease formulation’s additive package

Improper grade selection accelerates seal deterioration and compromises valve operability testing outcomes in locomotive service conditions.

Cleaning Before Applying Grease

Once you’ve matched your lubricant grade to your locomotive valve gear specifications, the condition of the surfaces receiving that grease determines whether your selection pays off. Use compressed air to dislodge accumulated debris from expansion links and radius rod connections. Avoid wire brushes near critical valve surfaces and bearing areas since they’ll scratch precision components.

For steam-sensitive components on locomotive valve assemblies, control your cleaning temperatures carefully to prevent thermal shock to cast iron parts. After cleaning, use lint-free cloths to eliminate fiber contamination that causes valve sticking and adjustment drift in slide valve and piston valve configurations. Set heat guns to low temperatures to evaporate remaining moisture without warping valve gear linkages.

Document pre-cleaning wear patterns and corrosion spots before applying fresh lubricant, establishing baseline conditions for future locomotive maintenance comparisons. Increased wear in valve gear linkages produces later valve opening, so noting and recording these wear spots before lubrication helps identify components approaching the threshold where balanced port opening across forward and reverse running becomes compromised.

Run Compression and Leak-Down Tests to Confirm WABCO Valve Performance

leak down and pressure diagnostics

Running compression and leak-down tests on your WABCO valve system requires methodical preparation before any disassembly begins. Shut down the locomotive engine, remove all necessary access covers, and rotate the crankshaft to top dead center. This position locks both intake and exhaust valves closed, establishing proper cylinder sealing for accurate pressure diagnostics across the locomotive’s braking and air systems.

Connect your leak-down tester adapter, matching thread specifications to the designated test port precisely. Your industrial air compressor supplies consistent input pressure through the hose assembly during the diagnostic procedure. A leak percentage reading of 20% or more generally signals inadequate cylinder sealing and warrants further mechanical investigation.

Monitor these critical benchmarks during testing:

  • Control pressure must reach 7 bar at cut-off for valid WABCO performance verification
  • Brake pipe leakage must stay under 5 pounds per minute
  • Main reservoir leaks cannot exceed 3 pounds per minute

Document every pressure reading and leak percentage throughout the locomotive air brake circuit. Pressure loss in a locomotive application indicates piston ring deterioration, compromised valve seats, or cylinder wall damage requiring immediate component inspection and service. Given the safety-critical nature of locomotive braking systems, any readings outside acceptable thresholds demand prompt corrective action before the unit returns to active rail service.

Keep a WABCO Valve Calibration Log That Actually Gets Used

locomotive wabco valve calibration

Pressure readings and leak percentages documented during WABCO valve testing serve their full diagnostic value only when systematically recorded and consistently referenced across locomotive service intervals. Standardize your forms to capture compressor model, serial number, and component identification for digital traceability throughout maintenance cycles specific to locomotive applications.

Pressure readings only deliver diagnostic value when systematically recorded and consistently referenced across locomotive service intervals.

Log pressure readings at specific engine speeds, documenting control pressure at 7 bar cut-off specifications relevant to locomotive braking and air supply systems. Record ambient temperatures, particularly during operations below 6°C where heat activation protocols become critical to safe locomotive function. Include technician certification levels to maintain qualified personnel accountability across depot maintenance teams.

For maintenance integration, timestamp coupling wear measurements exceeding 7mm and document genuine WABCO part numbers for warranty tracking within locomotive overhaul schedules. Establish oil consumption baselines against 12 bar pressure line test results to detect deterioration trends before they compromise locomotive air system reliability.

User adoption depends on accessibility. Store records in a digital database enabling rapid retrieval of historical data for trend analysis across locomotive fleets. When technicians can quickly reference previous tightness tests, cut-off pressure benchmarks, and bearing clearance measurements from earlier service intervals, the calibration log becomes an active diagnostic instrument embedded in the locomotive maintenance workflow rather than archived paperwork gathering dust between scheduled inspections. Using WABCO TOOLBOX PLUS software, technicians can cycle individual valves or all valves in sequence to verify correct installation and wiring during scheduled locomotive valve assessments.

Frequently Asked Questions

How Often Should WABCO Valve Calibration Be Performed Between Major Overhauls?

Like clockwork ticking in a complex locomotive system, you’ll need to perform WABCO valve calibration at every 368-day interval between major overhauls. You must conduct scheduled inspections within these cycles, documenting all pressure tests and component verifications specific to locomotive braking systems. Don’t overlook seasonal adjustments, as locomotive operating conditions and environmental factors change throughout the year. You’re required to verify proper charging within 15 psi of operating pressure and maintain brake pipe leakage under 5 lbs/min during each cycle to ensure the continued safe and efficient performance of your locomotive’s braking infrastructure.

Can WABCO Valve Calibration Be Performed Safely by a Single Technician Alone?

While solo safety is possible, you shouldn’t attempt WABCO valve calibration entirely alone on locomotive braking systems. You’ll need remote monitoring capabilities or a second technician to observe pressure readings at multiple test points simultaneously. Critical pressure differentials between the brake pipe and reservoir systems in locomotive applications require concurrent observation. If you must work alone, verify that remote monitoring equipment is fully active and that qualified WABCO technical support remains available throughout your calibration procedure.

What Is the Typical Cost of Professional WABCO Valve Calibration Service?

Typical pricing for professional WABCO valve calibration in locomotive applications ranges from $500 to $2,500, depending on service tiers and system complexity. For a regional rail operator facing an emergency recalibration, expedited same-day service can run $1,500–$3,000. Diagnostic fees before work begins typically fall between $150–$400, plus $85–$150 per hour in labor costs. Preventive maintenance contracts for locomotive braking and pneumatic systems can reduce overall costs by 15–30% compared to individual service rates.

Are WABCO Valve Calibration Procedures Different for Older Versus Newer Locomotive Models?

Yes, WABCO valve calibration procedures differ markedly between older locomotive models and newer locomotive models. With older locomotives, technicians rely on mechanical tools such as degree wheels, dead-center indicators, and manual pressure gauges to verify pneumatic timing across braking and control systems. With newer locomotive models, the process shifts toward ECU diagnostic interfaces, multimeters, and manufacturer-specific software to calibrate solenoid controls and sensor feedback loops with greater precision. It is critical to match your procedures and equipment precisely to your locomotive’s generation, as applying the wrong calibration method can compromise braking performance, air distribution accuracy, and overall operational safety on the rail line.

Which WABCO Locomotive Models Require the Most Frequent Valve Calibration Intervals?

Frequent maintenance models requiring your closest attention include pre-2000 WABCO locomotive assemblies (every 120 days), high-frequency duty cycle units in yard switching operations (every 120-150 days), and load-sensing diaphragm systems used in locomotive brake applications (every 180-240 days). If you’re managing high-usage locomotive fleets operating beyond 500,000 hours, monthly calibration checks become essential. Standard 26L locomotive models require calibration every 368 days, making aging locomotive equipment and yard-service units your most demanding calibration priorities.

Troubleshooting Electronic Brake Interface in WABCO Locomotives: Top 10 Fixes

Troubleshooting Electronic Brake Interface in WABCO Locomotives: Top 10 Fixes

Locomotive technicians often waste hours chasing EPIC brake faults without a clear starting point. Random part replacement increases downtime and cost. A structured diagnostic path reduces guesswork. It protects expensive WABCO components and improves fleet reliability. With the right sequence, you fix faults faster and avoid repeat failures.

  • Always pull J1587 codes before touching components
  • Separate electrical, pneumatic, and mechanical symptoms early
  • Verify sensor gaps before suspecting the EPIC ECU
  • Check wiring integrity before replacing valves
  • Confirm air supply quality and dryer performance
  • Inspect for heat damage around brake cabinets
  • Test battery and alternator output under load
  • Record baseline pressures at key test ports
  • Use only genuine WABCO locomotive brake parts
  • Document each step for repeatable fleet procedures
Pain PointImmediate ActionWhy It Helps
Unsure where to start troubleshootingDownload active and stored J1587 codesNarrows faults before physical inspection
Repeated EPIC brake failuresStandardize a step‑by‑step diagnostic checklistRemoves guesswork and random part swapping
Inconsistent brake responseVerify wheel speed sensor gaps on all axlesRestores accurate slip and speed control
Frequent component burnoutsInspect harness routing and heat shieldingPrevents recurring heat‑related failures
Unstable brake performanceCheck voltage stability at EPIC ECU power pinsAvoids logic errors from low or spiking VDC
Air pressure drops under loadLeak‑test circuits and diaphragms with gaugesPinpoints hidden pneumatic losses
Water or oil in brake airInspect filters, dryers, and compressor outputProtects valves and EPIC pneumatic modules
Confusion over parts qualityUse genuine WABCO parts from Mikura InternationalEnsures compatibility and long‑term reliability

To troubleshoot the WABCO EPIC electronic brake interface on locomotives, always start with data. Connect the diagnostic tool. Pull active and historical J1587 fault codes before touching any component. This isolates electrical, pneumatic, and sensor‑related issues quickly.

From there, move to the wheel speed sensors. Check every sensor gap against WABCO locomotive specifications. Inspect tone wheels for damage or contamination. A small gap error can cause major EPIC braking issues under adhesion limits.

Next, examine wiring integrity. Inspect harnesses from the EPIC ECU to sensors and solenoid valves. Look for chafing, crushed sections, loose connectors, and corroded pins. Pay special attention near trucks, junction boxes, and high‑heat areas. Repair or replace damaged harnesses using proper locomotive‑grade materials.

Test solenoid valve function methodically. Use the diagnostic tool or manual activation methods specified for your locomotive. Confirm each valve responds correctly and vents or supplies air as commanded. Compare valve performance on suspect trucks with a known good truck, when possible.

Check the pneumatic side in detail. Use calibrated gauges on key test ports. Identify air leaks in brake pipe, control pipe, and cylinder circuits. Listen for leaks and apply soap solution where needed. Inspect diaphragms and seals in relay and control valves for damage that causes slow or lost pressure.

Evaluate heat exposure around the electronic brake cabinets. Look for discolored insulation, brittle wiring, or melted conduit. Confirm that cooling fans, louvers, and cabinet seals work properly. Persistent overheating can shorten EPIC ECU and valve manifold life.

Inspect for ECU moisture intrusion. Open cabinets only as allowed by safety procedures. Check gaskets, door alignment, and drain paths. Look for corrosion on connectors or PC boards. Moisture issues often present as intermittent, temperature‑dependent faults.

Verify locomotive power quality. Measure voltage at the EPIC ECU supply under different operating conditions. Watch for dips during engine cranking and spikes during load changes. Correct charging system faults, grounds, or loose power connections before condemning the ECU.

Each failure mode demands a specific fix. Sensor gap errors call for precise adjustment and secure mounting. Wiring issues require proper splicing, routing, and strain relief. Pneumatic leaks need seal replacement and torque checks. Heat and moisture problems demand cabinet and airflow corrections.

Work through each cause in diagnostic order. Do not skip steps, even if a likely culprit appears early. This disciplined sequence prevents repeat callouts and misdiagnosed ECUs. For replacements, use genuine WABCO locomotive brake components sourced through Mikura International. You will find every critical repair procedure covered in the detailed sections that follow in your maintenance program and OEM manuals.

Key Takeaways

  • Retrieve active and historical J1587 fault codes from the ECU before beginning any physical inspection or repair work on the brake system.
  • Inspect wheel speed sensor gaps first, setting the sensor-to-tooth wheel clearance between 0.2–0.5 mm using feeler gauges.
  • Verify ABS solenoid coil resistance between 4.0–9.0 Ω and confirm operation within ±15% of rated supply voltage.
  • Replace the WABCO EPIC Valve Assembly (part 05934471001) when brake response times exceed tolerances by more than 15%.
  • After any ECU replacement, verify electrical connectors, inspect CAN data connections, run static locomotive tests, and update the maintenance log.

How the WABCO EPIC Electronic Brake Interface Controls Brake Pressure

electronic controlled proportional pneumatic braking
  • The WABCO EPIC system links electronic controls with pneumatic components on locomotives.
  • It regulates brake pressure distribution across the entire locomotive consist.
  • Its microprocessor-based design converts engineer commands into precise pneumatic responses.
  • This reduces lag between operator input and actual brake reaction.
  • Adaptive algorithms calculate optimal brake pressure for multiple axles.
  • They prevent wheel lockup and maintain consistent braking during steep grade descents.
  • Pneumatic operating units receive electronic signals from the control module.
  • They proportionally regulate airflow to each brake cylinder.
  • This enables smooth, graduated pressure application instead of simple on/off braking.
  • Integrated sensors provide continuous feedback on brake line and cylinder pressures.
  • They send real-time data to the central electronic control unit.
  • Electronic feedback loops compare actual and target pressures.
  • They correct deviations within milliseconds to maintain safe braking performance.
  • Redundant electronic channels protect critical brake control functions.
  • A dual-channel power supply maintains operation during certain electrical faults.
  • These features support reliable and precise brake pressure control in modern locomotive applications.
  • EBS communicates only on J1939, requiring a power cycle after any protocol change to re-establish adapter communication.

Read WABCO EPIC J1587 Fault Codes Before Touching Any Component

read j1587 fault codes

Before working on any WABCO EPIC system in a locomotive or marine engine, read the J1587 fault codes first.

Access the ECU and retrieve active and historical codes.

Study the patterns across all monitored wheel positions or axles.

Each PID–FMI combination narrows the root cause.

It shows if you face sensor calibration issues, wiring faults, or mechanical damage.

PID CodeFMI CodeIndicated Fault
0–4 (Wheel Position)FMI 1Air gap exceeded, bearing wear
0–4 (Wheel Position)FMI 5Circuit open, corroded connector
0–4 (Wheel Position)FMI 4Short to ground, damaged insulation

Fix ABS Warning Lights Triggered by Pressure Imbalance

inspect sensors wiring hydraulics

When an ABS warning light indicates pressure imbalance, you’ll need to systematically eliminate mechanical and electrical causes before suspecting the ECU or modulators. Start by inspecting wheel speed sensor gaps and tone ring alignment, since weak or intermittent signals frequently register as pressure deviation faults rather than actual hydraulic failures. From there, check connector integrity, solenoid valve condition, and grounding paths, as contamination, wiring faults, and voltage instability each independently trigger false pressure imbalance codes that clear once you’ve restored stable signal and power delivery. Uneven brake pad wear from misalignment can also produce false pressure imbalance readings, so verify pad condition and alignment before concluding that the fault originates in the electrical system.

Diagnosing Pressure Imbalance

  • Focus on pressure sensor checks, air system leak detection, solenoid power verification, ABS modulator and ATC resistance, and wheel sensor gap.
  • Begin by confirming the brake pressure sensor receives 8.0–16.0 volts DC.
  • Check for sensor hysteresis that causes unstable or drifting pressure signals.
  • Inspect all pneumatic or hydraulic coupling points along the brake circuit.
  • Listen for air leaks or hissing when the brake system is applied.
  • Verify each ABS solenoid operates within ±15% of its rated supply voltage.
  • This prevents overheating, burnout, and nuisance ABS fault codes.
  • Measure ABS modulator coil resistance between 4.0–9.0 ohms using a calibrated meter.
  • Confirm ATC valve coil resistance stays within 7.0–14.0 ohms.
  • Set the wheel speed sensor-to-tooth wheel gap between 0.2–0.5 mm.
  • Incorrect gap can cause false speed readings and trigger ABS warnings.
  • Moisture in air lines can degrade ABS and ATC performance and risk system freezing in cold weather conditions.
  • Mikura International supports operators with components and guidance for stable locomotive and marine brake performance.

Restoring ABS System Balance

Next, complete sensor recalibration for the locomotive ABS. Confirm the Brake Pressure Sensor receives 8.0–16.0 volts. Ensure it transmits accurate signals to the ECU. Check solenoid valve resistance with a calibrated meter. ABS modulator valves must show 4.0–9.0 ohms. Active Braking Valves must show 7.0–14.0 ohms. Correct or replace any faulty components before proceeding. Reset the ECU using authorized TOOLBOX Software. Then cycle the locomotive ignition and monitor system status. Confirm pressure balance is restored across all brake circuits. This manual covers both ABS and ESC systems, making it a comprehensive reference for diagnosing interconnected brake control faults.

Repair Broken Wheel Sensor Wiring and Gap Misalignment

intermittent wheel sensor faults

Broken wheel sensor wiring and gap misalignment are difficult to diagnose on locomotives. These faults are often intermittent. Fault codes appear, disappear, and reappear with vibration or temperature changes. Connector movement on a running locomotive can also trigger temporary faults.

Inspect sensor insulation near the brake assembly. Look for cracking, abrasion, or tension stress at every flex point. Damage here can cause intermittent open circuits during locomotive operation. Compromised magnetic shielding along the cable also creates problems. Electromagnetic interference can distort the sensor signal reaching the ECU.

For gap misalignment, verify sensor output at low wheel speed. Check the sensor produces at least 0.2V AC at 30 RPM. Anything lower indicates incorrect positioning relative to the tone ring. This can cause speed readings to drop out at low speeds.

  • Check sensor cables at all flex points for broken conductors or damaged insulation
  • Measure sensor-to-tone-ring gap with feeler gauges to match the locomotive manufacturer specification
  • Clean tone ring teeth thoroughly and remove rust or debris
  • Inspect for missing, worn, or impact-damaged tone ring sections before re-testing output voltage

Correct both wiring and gap issues before clearing fault codes in the locomotive control system. Regular sensor checks are recommended to ensure proper functionality and effective brake system intervention.

Clear Clogged Solenoid Valves in EPIC Valve Assemblies

epic solenoid valve cleaning
  • Clogged solenoid valves in EPIC assemblies often result from moisture and oil in locomotive brake air systems.
  • Solenoid valve clogs in EPIC assemblies trace back to moisture and oil contaminating locomotive brake air systems.
  • Mineral deposits form as moisture dries inside the valve passages.
  • Oil aerosols from the compressor also collect and harden in small orifices.
  • These blockages trigger diagnostic trouble codes in the “7” or “8” series.
  • Such codes indicate BC control and BC equalizing control failures on locomotive brake systems.
  • Confirm obstruction using calibrated pressure gauges during brake application tests.
  • Look for pressures that fail to reach specified values within the expected time.
  • Inspect the exterior of the valve housing for staining and discoloration.
  • Such marks can indicate internal corrosion and moisture exposure.
  • Use clean, dry compressed air to flush valve passages at controlled pressure.
  • Avoid excessive pressure that may damage seals or delicate internal parts.
  • This step removes loose particles without affecting valve metallurgy.
  • For hard mineral scale, use an ultrasonic cleaning bath on removed valve bodies.
  • Alternatively, apply only pneumatic-approved chemical solvents for oxidized buildup.
  • Observe manufacturer limits for temperature, exposure time, and compatible materials.
  • Disassemble the EPIC valve assembly on a clean workbench.
  • Inspect each orifice and passage under good lighting and magnification.
  • Check coil insulation for burns, cracks, or swelling during the same procedure.
  • Flush from the main reservoir and supply tank outlets toward the brake cylinders.
  • This direction prevents debris from migrating back into cleaned components.
  • Repeat the flushing until no contamination appears at the drain points.
  • After cleaning, replace desiccant cartridges in the air dryer system.
  • Service or replace air intake filters on the locomotive compressor as required.
  • These steps reduce future moisture and oil carryover into EPIC valves.
  • A master cylinder with an aluminum or steel body can serve as a reference point when evaluating material compatibility in hydraulic-adjacent pneumatic brake component replacements.
  • Record all cleaning, parts replaced, and test results in the locomotive maintenance log.
  • Verify correct operation through functional brake tests before returning the unit to service.

Find ECU Failures Caused by Water Intrusion and Voltage Spikes

water intrusion and spikes

Water intrusion and voltage spikes can severely damage locomotive ECU brake systems.

Use a systematic approach to distinguish both failure modes.

Inspect all ECU connectors first.

Corroded connectors show white or green deposits on pins.

These often trigger intermittent fault codes 521 or 563.

Voltage spike damage looks different.

You may see burned PCB traces or cracked components.

Power transistors and drivers may fail without visible corrosion.

Calibration parameters can corrupt after transients above 20 volts.

Watch for these diagnostic patterns:

  • Fault codes that disappear and reappear during wet weather suggest moisture in sensor cables.
  • Multiple brake circuit faults at once point to power or ground degradation.
  • Blown surge protection parts and damaged IGBTs indicate inductive spikes from solenoid valve switching.

After completing repairs, improve long‑term protection.

Apply silicone conformal coating on exposed ECU areas.

Use sealed connector designs to reduce future moisture ingress in locomotive environments.

Measure input voltage stability during deceleration events to identify supply drops that may contribute to recurring ECU faults.

Stop Air Leaks Destroying EPIC Brake Chamber Pressure

prevent epic brake chamber leaks
  • Once you secure the ECU from moisture and voltage spikes, check air integrity next.
  • Pressure loss in EPIC brake chambers reduces braking force.
  • This creates serious safety risks for locomotives and marine engines.
  • Begin with a static leak test on the air system.
  • Measure system pressure drop with all controls in the run position.
  • Allow pressures to stabilize before recording readings.
  • Follow the OEM-recommended pressure drop limits for your locomotive or vessel.
  • Use these as your baseline instead of road-vehicle standards.
  • Apply a soap solution to all suspect joints and fittings.
  • Watch for growing bubbles around unions, valves, and chamber ports.
  • Growing bubbles confirm a high-pressure air leak.
  • For complex pipe runs, use a dry ice fog method.
  • Introduce fog into the line and follow any escaping vapor.
  • This method helps trace hidden leaks in confined engine rooms.
  • Prioritize typical failure points around EPIC brake chambers.
  • Inspect for chafed hoses along bulkheads and under walkways.
  • Check worn O-rings in valve blocks and connection manifolds.
  • Look for cracked chambers on mounting brackets or support frames.
  • Examine diaphragms for damage that vents air through chamber vents.
  • Marine atmospheres and locomotive operating environments are harsh.
  • Salt-laden air and humidity accelerate seal degradation.
  • Apply suitable protective coatings on exposed metal surfaces.
  • Use corrosion-resistant hardware where practical.
  • Install moisture traps or air dryers in supply lines.
  • These reduce water vapor buildup in EPIC brake chambers.
  • Condensed water can freeze or carry debris into valves and seals.
  • Replace failed diaphragms immediately after detection.
  • Spring brake sections usually experience the highest stress.
  • Piggyback sections can also fail under repeated cycling.
  • Check mounting bolts for correct torque each maintenance cycle.
  • Loose bolts can distort chamber housings and damage seals.
  • Inspect glad-hand style or coupling seals in locomotive air lines.
  • Hardened or cracked seals must be renewed without delay.
  • Document all leaks found and repairs performed.
  • Use this data to refine inspection intervals and spare parts planning.
  • A saturated desiccant cartridge in the air dryer can cause the purge valve to stick open, allowing continuous pressure loss that undermines brake system integrity.

Replace Failed EPIC Diaphragm Seals Before Brake Chamber Pressure Fails

replace failing epic diaphragms promptly
  • Across EPIC brake chambers in locomotives, diaphragm seal failure is usually audible.
  • You may hear hissing during service brake activation.
  • After shutdown, pressure can drop 60–70 PSI within minutes.
  • Cab warning indicators confirm pressure loss and imbalance.
  • The compressor may struggle to maintain safe system pressure.
  • Do not delay diaphragm inspection once these symptoms appear.
  • Early checks prevent in-service failures on mainline or yard operations.
  • During replacement, seal material selection is critical.
  • High temperatures above 150°C reduce diaphragm elasticity by about 50%.
  • Select heat-resistant compounds that match locomotive operating conditions.
  • Always use high-quality, application-approved diaphragm seals.
  • Torque cylinder head bolts to 25±5 Nm.
  • This ensures even clamping and uniform pressure distribution.
  • Perform pressure cycling tests at full governed speed.
  • Verify control pressure reaches 7 bar at cut-off.
  • Use regulatory compliance testing to identify specific chambers with deterioration.
  • Document test results for each brake cylinder on the locomotive.
  • Spring brake chambers can store 1,200–2,500 pounds of force.
  • Use certified, specialized tools for safe disassembly and servicing.
  • Cage bolt corrosion on spring brake chambers can lead to catastrophic release of stored spring energy if not inspected and replaced immediately.
  • Proactive diaphragm replacement reduces stopping distance risks.
  • It also minimizes costly unscheduled downtime and emergency repairs.
  • For EPIC brake chamber parts and seal replacement support in locomotives,
  • Mikura International can supply suitable components and technical guidance.

Fix Slow Brake Response From Heat-Damaged EPIC Components

heat damaged epic brake components
  • Heat damage affects EPIC brake components silently in locomotive and marine engines.
  • Heat damage silently compromises EPIC brake components in locomotive and marine engines before any visible failure occurs.
  • It degrades diaphragm elasticity, valve seals, and gaskets before failure becomes visible.
  • Slow brake response usually appears after extensive thermal stress on these components.
  • Temperatures above 150°C reduce diaphragm elasticity by nearly 50%.
  • This reduction prevents proper diaphragm expansion during repeated brake engagement cycles.
  • Run pressure drop tests at full governed engine speed in locomotives or marine engines.
  • Confirm whether heat-damaged components can maintain the 7-bar cut-off threshold.
  • Use thermal imaging during normal operation to locate abnormal hot spots.
  • These hotspots help pinpoint specific EPIC components suffering from heat concentration.
  • Implement protective measures immediately after confirming heat-related damage.
  • Apply thermal coatings around modulator valves in the engine compartment.
  • This reduces radiant heat absorption from nearby high-temperature engine sources.
  • Use suitable coolant additives approved for locomotive or marine applications.
  • They enhance circulation efficiency through brake-related cooling circuits and chambers.
  • This helps keep component temperatures below critical limits during continuous braking.
  • Maintain strict air-purging filter schedules in compressed air systems.
  • This prevents oil carryover that accelerates seal and gasket degradation.
  • Replace heat-compromised diaphragm seals and modulator valves in a controlled sequence.
  • Follow the engine manufacturer’s recommended torque procedure for cylinder head bolts.
  • Typically, torque values are around 25±5 Nm for many EPIC assemblies.
  • Correct torque restores consistent pressure distribution within the brake system.
  • Mikura International supports reliable sourcing of EPIC brake components for locomotives and marine engines.

Replace the WABCO EPIC Valve Assembly When Repairs Stop Working

replace wabco 05934471001 assembly

When recurring DTCs persist after clearing memory bits, brake response times exceed tolerances by more than 15%, or stopping distances continue degrading despite calibration, you’ve reached the threshold where full valve assembly replacement becomes necessary. You’ll need to source part number 05934471001, the current WABCO Wabtec 30 A-CDW classification assembly, which maintains compatibility with your existing pneumatic piping and electrical wiring without requiring chassis modifications.

Once installed, you must verify all ECU electrical connectors, inspect CAN data connections, and run static locomotive test procedures to confirm the replacement assembly operates within specifications across all brake application modes. SPW Industrial provides a one-year warranty against defects in workmanship and material under normal use, covering the replacement assembly from the date of purchase.

Signs Replacement Is Necessary

Even after replacing ABS valves and individual components, some issues may continue.

Recurring air leaks and delayed brake response indicate deeper problems.

Persistent pressure imbalances can mean the WABCO EPIC Valve Assembly has reached the end of its service life.

Audible diagnostics and material testing help confirm this condition.

They show when diaphragm degradation exceeds acceptable repair thresholds in locomotive or marine braking systems.

You will recognize these critical failure indicators:

Air Leak Persistence: Hissing from brake chambers during service activation shows serious internal leakage.

Pressure losses of 60–70 PSI within minutes indicate diaphragm seal failure beyond repair.

Delayed Brake Response: Worn diaphragms cannot generate sufficient pressure quickly.

Brake response becomes sluggish in locomotive or marine applications.

Under temperature extremes exceeding 150°C, diaphragm elasticity may reduce by 50 percent.

Dashboard Warning Activation: Pressure imbalances can trigger multiple warning indications.

Brake warning lights and low air supply alerts may appear on the operator’s display.

These conditions can cause DOT or FRA brake tests to fail on locomotives.

Marine engines using similar control systems can also show non‑compliance alarms.

A communication link failure between the micro air brake system and control modules may also appear as a dashboard fault message requiring immediate attention.

EPIC Valve Replacement Steps

Replacing the WABCO EPIC Valve Assembly becomes necessary when repairs no longer restore reliable brake performance on your locomotive.

Before starting, complete your safety checklist.

Park the locomotive on level track and secure it.

Chock the wheels and engage the parking brake.

Allow the air system pressure to fully bleed down.

To remove the old valve, first disconnect the wiring connector by hand.

Next, detach the Port 1 and Port 2 air lines carefully.

Remove both mounting capscrews and the corresponding nuts.

Install the new assembly using the original mounting location.

Secure the mounting hardware to the specified torque values.

Connect the Port 2 air line first on the locomotive brake system.

Then connect the Port 1 air line and check alignment.

Hand-tighten the wiring connector to avoid damage.

Once connected, apply the brakes and listen for air leaks.

Verify there is no pressure drop in the brake system.

Cycle the locomotive ignition to confirm proper valve cycling.

Perform a controlled test movement to verify ABS lamp operation.

Document the replacement in the locomotive maintenance log.

Why WABCO 26L Assembly Integration Issues Persist?

Why WABCO 26L Assembly Integration Issues Persist?

Unexpected brake faults, inconsistent response times, and repeat WABCO 26L failures are more than frustrating. They stop locomotives, disrupt schedules, and inflate maintenance costs. Technicians often replace parts without fixing root causes. Wiring checks look fine, yet faults return under load. Shops need clear guidance on how electrical, pneumatic, and firmware issues interact.

  • Random brake application or release during operation
  • Fault codes that disappear in the workshop but return in service
  • Over‑sensitive or under‑responsive dynamic braking transitions
  • Repeated valve or module replacement with no lasting improvement
  • Difficulty reproducing failures on test stands
  • Confusion between wiring faults, sensor faults, and ECU faults
  • Inconsistent brake feel between locomotives in the same fleet
  • Limited OEM documentation for mixed‑generation 26L + EBS setups
  • Pressure tests passing, but performance still feels unsafe
  • Lack of integration know‑how during post‑repair commissioning
Pain PointLikely Root Cause AreaQuick CheckRisk if Ignored
Intermittent brake faults in serviceElectrical integrityMeasure loaded voltage at WABCO modulesSudden loss or surge in braking
Different brake feel between locomotivesCalibration / firmwareCompare config files and event logsUneven train handling
Frequent valve or module replacementWiring / grounding issuesInspect harness routing and shield term.Rising spares and labor cost
Faults vanish in workshopVibration and temperatureLog data during on‑track testingHard‑to‑trace intermittent issues
Pressure correct, behavior wrongSignal–pressure mismatchCorrelate sensor data with brake curvesUnsafe stopping distances
New parts, same old errorsMissed post‑repair stepsReview commissioning and test protocolRepeat failures after release
CAN errors on mixed fleetsFirmware generation mismatchVerify part numbers and software levelsNetwork instability, false trips

The WABCO 26L persists as an integration problem on locomotives. It forces electrical signal integrity, pneumatic brake pressure, and CAN‑based firmware logic to coexist in one tightly coupled system.

A compromise in any single domain destabilizes the others on the locomotive. Voltage drops trigger false fault codes. EBS generation mismatches corrupt calibration maps. Skipped post‑repair procedures conceal emerging failures. Harsh locomotive environments accelerate every failure driver simultaneously. Understanding each layer separately is where real diagnostic clarity begins.

Mikura International supports locomotive operators by supplying genuine WABCO brake components and related parts. This helps maintenance teams focus on correct integration instead of questioning part authenticity.

Key Takeaways

  • Dual-domain coupling between electrical and pneumatic systems means degradation in one domain directly destabilizes the other, compounding integration failures.
  • Poor grounding disrupts EBS ECU communication and generates misleading fault codes that incorrectly implicate modulators, valves, or sensors.
  • Post-repair calibration is frequently skipped or performed incorrectly, leaving sensor errors and axle misconfigurations undetected until failure occurs.
  • Silent firmware mismatches and network disturbances degrade brake performance before fault codes appear, delaying accurate diagnosis.
  • Generic diagnostic tools miss real-time signal distortion and intermittent faults, preventing technicians from identifying true root causes.

What Makes WABCO 26L Assembly Integration So Persistently Problematic?

coupled electrical pneumatic system failures

The WABCO 26L assembly creates persistent issues because of its dual-domain design reality.

It must manage electrical signal integrity and pneumatic brake pressure in one coupled unit.

When one domain degrades, the other loses stability and performance.

On locomotives, this becomes more complex due to long cable runs and harsh vibration.

Marine engines add moisture, corrosion, and hull-borne vibration to the same problem set.

Multiple factors drive recurring faults.

Sensor calibration errors create pressure deviations in critical braking cycles.

Network disturbances disrupt electronic brake control command delivery along the locomotive or vessel.

Poor grounding or incorrect wiring causes intermittent failures that defy quick diagnosis.

Older locomotive or marine electrical infrastructure may not fully match the 26L communication needs.

Fault logging occurs when sensor inputs become inconsistent, potentially reducing braking performance as a protective measure.

Calibration demands increase the integration challenge.

Post-repair calibration is mandatory but often skipped or performed incorrectly.

Tone ring misalignment leads to unstable wheel speed feedback on locomotives.

Wrong axle configuration parameters corrupt braking logic and system protection limits.

Missed low-speed brake tests after installation hide emerging fault conditions.

You are not dealing with a single, isolated device.

You are managing linked mechanical, pneumatic, and electronic dependencies in real time.

In locomotive and marine environments, these dependencies become tightly coupled and unforgiving.

Why Mixing EBS Generations Destroys 26L Firmware Compatibility

mixed generation ebs breaks compatibility

Persistent integration failures are not only caused by miscalibrated sensors or poor grounding.

They also appear when different EBS generations are mixed within the same 26L locomotive system.

Generation mismatch disrupts protocol integrity at several layers of the control architecture.

This makes firmware compatibility extremely difficult to sustain over the life of the locomotive.

Here is what happens when incompatible EBS generations are introduced in a locomotive brake system:

1. CAN communication collapses

EBS 3 expects high‑speed J1939 data formats used in many modern locomotives.

Older modules transmit frames the EBS 3 ECU interprets as malformed messages, causing repeated timeouts.

2. Signal formats conflict

EBS 2 actuators may output analog or different PWM profiles to control locomotive brake valves.

The EBS 3 controller flags these as invalid, triggering fault codes such as SPN 521 and ABS 10.

3. Calibration maps misalign

EBS 3 firmware applies pressure curves tuned for its own generation of locomotive brake hardware.

When connected to EBS 2 valves, the pressure response deviates, producing recurring EBS 434 faults.

4. Configuration sequence fails

During startup, the ECU reads part numbers from all connected EBS modules on the locomotive.

Unexpected or mixed‑generation identifiers cause the configuration routine to abort.

The ECU then disables correct brake recognition, modulation, and equalization across locomotive axles.

When the configuration routine processes mixed identifiers across stages, rounding errors accumulate, degrading the precision of each subsequent brake parameter calculation the ECU performs.

Each failure amplifies the next.

The result is a degraded locomotive brake system that becomes hard to trust and harder to diagnose.

How Connector Fit Fools Technicians Into Wrong 26L Sensor Pairings?

connector fit masks protocol differences

When a replacement 26L sensor’s connector mates cleanly with the harness plug, you’re likely to assume electrical compatibility—but physical fit doesn’t confirm signal protocol alignment, voltage tolerance, or CAN message structure. You can install a cross-generation sensor that powers up, passes a basic circuit check, and even streams plausible live data while the underlying pin assignments route signals incorrectly. Swapping sensors across EBS generations without verifying part number metadata exposes the system to silent firmware mismatches that degrade brake performance before a single fault code appears. Cross-referencing against the WABCO 480 series catalog numbers confirms whether overlapping part numbers within the same module family actually share compatible signal architecture.

Physical Fit Versus Electronic Compatibility

One of the most deceptive traps in WABCO 26L service work is the J2030 6‑pin Deutsch connector.

It fits identically across EBS 3, EBS 4, and EBS 5 sensor generations.

Locomotive and marine technicians often assume identical connectors mean full compatibility.

That assumption is dangerous on propulsion and braking systems.

There are no connector keying differences across these sensor generations.

So physical fit guarantees nothing electronically.

Here is what actually happens when you install the wrong sensor.

  1. The mismatched sensor transmits unreadable data to the ECU.
  2. Signal protocols differ across generations in locomotive and marine applications.
  3. The ECU rejects the sensor’s digital signatures during the software handshake.
  4. This rejection triggers calibration faults on the control system.
  5. The system can enter failure mode and restrict advanced EBS functions.
  6. You may see fault codes such as SPN 521 in diagnostic logs.
  7. These codes can lead to repeated, incorrect component replacements.

You cannot verify compatibility by visual inspection.

You must cross‑reference the full 12‑digit WABCO part number.

Then confirm that the communication protocol matches the ECU generation.

Always verify this before installation on any locomotive or marine engine system. An unprogrammed or misconfigured module can trigger false error codes that further obscure the root cause of sensor incompatibility during post-installation diagnostics.

Cross-Generation Sensor Swapping Risks

Cross-generation sensor swapping in WABCO 26L assemblies does not always show an error.

The sensors may appear correct and fit perfectly in place.

Bench tests can pass when connectors seat cleanly and resistance values look normal.

The real problem appears later during live operation.

The issue is not mechanical.

The failure happens at the protocol and signal level.

Different EBS generations use different signal characteristics.

EBS 3, EBS 4, and EBS 5 sensors can share identical housings.

However, they can transmit incompatible signals to the control unit.

In a locomotive braking system, this causes serious risk.

The control unit detects signal integrity violations during operation.

It logs implausibility fault codes, such as SPN 521.

The system may then shift into a degraded braking mode.

Initial self-checks may pass when the locomotive is stationary.

They can then fail under dynamic braking conditions.

You cannot use connector fit as a compatibility check.

Always confirm the full part number suffix before installation.

Match the sensor exactly with the correct EBS generation.

This practice helps maintain safe and reliable locomotive braking performance.

Passive WABCO ABS sensors should measure within the expected 1,000–1,300 ohm resistance range as a baseline electrical verification step.

Calibration Steps Most Teams Skip After 26L Brake Service

verify ebs settings test

After completing 26L brake service, you must verify axle configuration settings in your diagnostic software to guarantee the module reflects the correct brake system architecture—mismatched parameters cause false alerts and compromise DOT compliance. You’ll then need to run a full EBS parameter check using TOOLBOX version 12 or higher with a J1939-compliant adapter to confirm every sensor type and load-based braking preference aligns with the vehicle’s programmed specifications.

Finally, you can’t skip post-service low-speed testing, which validates that SAS calibration and ESC initialization were performed in the correct sequential order before returning the vehicle to service. The E8 ESC End of Line procedure is also required after steering repair or replacement and must be completed following any front wheel alignment.

Axle Configuration Settings Verification

When servicing the WABCO 26L brake system on a locomotive, axle configuration settings are often skipped.

Skipping this calibration step can create serious operational problems.

Incorrect axle configuration corrupts wheel assignment logic within the braking network.

It also invalidates sensor diagnostics across the entire brake control system.

Use WABCO TOOLBOX (v12+) with an RP1210C-compliant adapter for configuration checks.

Confirm the electronic configuration matches the locomotive’s physical brake architecture.

Verify these four parameters carefully:

  1. Axle configuration selection (for example 4S/4M or 6S/6M) matches the installed locomotive hardware.
  2. Sensor type, whether active or passive, and tooth wheel data are entered exactly as specified.
  3. Wheel diameter, equivalent tire size settings, and axle load ratings match actual locomotive specifications.
  4. Voltage supply to the ECU remains within 9.0–16.0 volts under normal operating conditions.

Finish by running a complete fault code scan.

Confirm there are no active faults before returning the locomotive to service with Mikura International support. Intermittent faults can be difficult to locate and repair, making thorough fault code review essential before clearing the system for operation.

Post-Service Low-Speed Testing

Many teams skip it, but that creates real safety risks.

Skipping calibration can hide sensor faults on locomotive brake systems.

It can also cause system initialization failures in critical control modules.

Always verify sensor contact at the tone ring.

Confirm at least 0.2 volts AC output at 30 RPM wheel rotation.

Inspect for test-stand induced faults before moving forward.

Workshop dynamometers can create misleading fault codes on locomotive systems.

These false codes can corrupt brake calibration results if left unchecked.

Check all sensor cables for 900–2000 ohms resistance.

Confirm vehicle supply voltage stays between 9.0 and 16.0 volts.

Voltage fluctuation can trigger false ABS-related fault indications in locomotives.

Clear all active fault codes outside allowable SAS or ESC parameters.

Do this before starting the brake calibration sequence.

If these steps are skipped, SPN 520210 FMI 14 may remain active.

That condition blocks proper ESC initialization on the locomotive.

Full EBS Parameter Check

Completing a full EBS parameter check after 26L brake service is never optional.

It is the step many maintenance teams skip.

This is where calibration failures usually begin in locomotive and marine brake systems.

After service, you must verify every parameter before the unit returns to operation.

Do not move the locomotive or sail the vessel before this verification.

Perform these four checks immediately after 26L installation:

  1. Confirm the ABS ECU receives stable 9.0–16.0 volts at all connectors.
  2. Complete sensor calibration. Verify wheel speed sensors read 900–2000 ohms. Confirm brake pressure sensor continuity holds.
  3. Perform axle verification. Confirm correct axle configuration and brake type settings. Match tone wheel configuration across all axles.
  4. Clear fault codes SPN 1807 FMI 08 and SPN 520210 FMI 14 after successful calibration.

Record the software version and EBS generation in your maintenance log.

Document all replaced sensor 12‑digit part numbers for traceability.

A single mismatched wheel speed sensor can degrade ABS responsiveness by 17% in wet conditions.

Ensure all records are complete before Mikura International releases the locomotive or marine engine back to service.

Voltage Drops and Ground Faults Behind False 26L EBS Codes

grounding fixes false ebs

Electrical faults in 26L EBS systems often arise from voltage drops and ground path failures. Components get blamed, but they are often fine.

In locomotives and marine engines, check grounding topology first. Poor grounding disrupts stable communication with the EBS ECU.

Corrosion between the main frame and bogies or mounting points increases resistance. This resistance interrupts reference signals and power return paths.

Any reading above 0.3 ohms between cab and frame needs attention. Values above this threshold indicate compromised grounding.

Voltage grading across power and control connectors is equally important. High current draw during dynamic braking causes voltage drops.

These drops can generate fault codes that resemble modulator or valve failures. The EBS system only reports symptoms.

Corroded pins with light green oxidation increase resistance over time. Both power and ground circuits degrade progressively.

On locomotives and marine engines, J1939 CAN bus errors can compound these issues. Ground loop interference corrupts sensor and actuator data.

Faulty terminating resistor symptoms may appear when ground circuits are unstable. The bus then shows intermittent or drifting values.

Do not rely only on the fault codes from the EBS controller. They usually flag “voltage low” without revealing the real cause.

Use a digital multimeter to measure resistance in the ground paths. Test both with the system idle and under electrical load. Basic diagnostics can be performed without a PIN, reserving PIN access only for security-relevant functions within the diagnostic software.

Confirm clean, low-resistance bonds between cab, frame, engine block, and control cabinets. Correct these before replacing any EBS component.

How Fault Code Symptoms Obscure the Real 26L Electrical Cause

sensor masking hides faults

Fault codes in the WABCO 26L EBS system can mislead marine and locomotive diagnostics.

They do not always indicate the real electrical failure.

Sensor masking is a core problem in these environments.

Sensor masking distorts signals in marine and locomotive environments, causing ECUs to misread mechanical issues as electrical faults.

Contamination or misalignment distorts sensor signals during marine or locomotive operation.

The ECU often misreads these as electronic faults instead of mechanical issues.

Waveform aliasing adds another blind spot.

Generic diagnostic tools miss real-time signal distortion under dynamic braking.

Intermittent faults vanish before technicians can capture accurate data.

Four patterns routinely hide the true electrical cause:

1. Outdated firmware flags valid sensor outputs as fault conditions.

This pushes diagnostics toward the wrong assemblies.

2. Oxidized ground terminals shift the baseline of sensor signals.

The system then mimics a sensor circuit failure on the locomotive or vessel.

3. Connector corrosion creates unstable electrical paths in harsh marine or rail environments.

These instabilities resemble ECU communication faults in the 26L system.

4. Intermittent fault histories may remain stored but unseen.

Many tools show only active codes, not historical patterns.

Stored DTCs are only cleared by deliberately clicking the Clear DTCs button, not by simply viewing or cycling power.

Each misleading symptom encourages unnecessary component replacement.

This wastes time and parts on marine engines and locomotives.

It also reduces reliability for operators who depend on accurate 26L diagnostics.

How Air Leaks Inside the 26L Modulator Valve Cause Pressure Faults

internal modulator valve leaks

Internal air leaks inside the 26L modulator valve often trigger pressure faults in locomotive brake systems.

These faults may appear as electrical issues in diagnostic logs.

However, the root cause is frequently pneumatic, inside the valve body itself.

Internal leakage past the valve seat causes continuous exhaust during brake application.

You can confirm this by observing the exhaust port on a running locomotive.

Air will exit the exhaust port only when you apply the brake valve.

Isolating downstream brake cylinders or brake rigging will not stop this exhaust.

This proves the leak is inside the modulator valve, not in the brake cylinders.

Equalizing leaks make troubleshooting even more difficult on locomotives.

Damaged O‑rings at gauge ports or mounting plates cause a steady pressure bleed.

This prevents the equalizing reservoir from holding a stable reduction.

The result is erratic brake pipe control and recurring pressure fault indications.

Leak TypeTrigger ConditionIndicated Repair
Valve seat leakageDuring brake applicationReplace modulator valve
Exhaust port leakWith brake pedal depressedTreat as internal valve leak
Equalizing reservoir leakContinuous pressure lossReplace O‑rings and fittings

Use soap solution or an approved smoke test on the locomotive brake stand.

Keep the brake stand cut in to locate active leaks under operating pressure.

When a modulator valve leaks continuously during service brake application, some technicians recommend replacing it with a non-ABS valve as an interim measure while sourcing OEM components.

Fix the Root Cause, Not Just the 26L Fault Code

diagnose before replacing modulators

A 26L fault code shows where to investigate, not what to replace.

Changing the modulator on a locomotive or marine engine without diagnostics wastes resources.

Replacing the 26L modulator without proper diagnostics wastes time, money, and resources better spent finding the real problem.

The fault will return if the root cause remains.

Complete these four checks before condemning the 26L assembly:

  1. Test control wiring and harnesses for ground faults, CAN bus errors, and voltage drop.
  2. Verify air supply quality by inspecting dryers, filters, and separators for moisture and oil contamination.
  3. Confirm sensor accuracy by checking pressure and load sensors that feed data to the brake control system.
  4. Inspect related brake components such as relay and quick-release valves for fault signatures similar to 26L.

Systematic diagnostics prevent cascade failures in locomotive and marine braking systems.

Fix the component that is truly defective. Aging leveling valves develop internal leaks that cause slow height drift, which can mask the true source of a recurring fault and lead to repeated misdiagnosis.

Frequently Asked Questions

Can Tone Ring Damage Trigger Recurring 26L Wheel Speed Sensor Faults?

Yes, tone ring wear can definitely trigger recurring 26L wheel speed sensor faults.

Cracks, missing teeth, or corrosion cause irregular magnetic pulse signals.

The locomotive control system reads these irregularities as sensor failure.

Recurring fault codes may appear even after replacing the wheel speed sensor.

This happens when the damaged tone ring keeps distorting the sensor signal.

Always inspect the tone ring condition during locomotive wheel speed sensor diagnostics.

Correct tone ring defects before deciding to replace the sensor again.

How Does ISO 7638 Socket Condition Affect 26L CAN Communication Reliability?

The ISO 7638 socket condition directly affects 26L CAN communication reliability.

Corroded CAN_H and CAN_L pins increase contact resistance.

Higher resistance attenuates signal levels and pushes them outside specification.

Locomotive control units then detect intermittent errors on the CAN bus.

You may see false communication fault codes and repeated retransmissions.

Prolonged degradation can even drive modules into bus‑off states.

Inspect socket pins on your locomotive at regular maintenance intervals.

Measure total CAN bus termination resistance from the ISO 7638 interface.

Clean oxidized pins carefully and replace severely pitted terminals.

Use approved dielectric grease to reduce moisture ingress at the connector.

This slows pin degradation and stabilizes your locomotive CAN network.

Does Suspension Modification After 26L Installation Require Full EBS Recalibration?

Yes. Suspension changes after 26L installation need full EBS suspension recalibration on locomotives or marine engines.

Update axle load parameters, ride height values, and brake force distribution settings in the ECU.

Without recalibration, the changed suspension geometry sends incorrect data to the control unit.

This can trigger fault codes, including WABCO EBS 434, on locomotive or marine braking systems.

Check and adjust sensor alignment on all height and pressure sensors after suspension work.

This helps avoid implausible signal errors and prevents uneven braking response in locomotive or marine applications.

What Sealing Methods Prevent Leakage During 26L Prototype Valve Testing?

Seal failure during 26L prototype valve testing can compromise entire locomotive brake assemblies.

Prevent leakage with precise O-ring selection matched to the brake system’s pressure and temperature range.

Ensure elastomer compatibility with the locomotive’s air supply quality and any condensate or oil carryover.

Apply potting compound carefully around electrical interfaces on control valves and sensor housings.

This blocks moisture ingress in harsh locomotive operating environments.

Verify the correct tightening torque on all valve fasteners using calibrated tools.

Inspect all sealing and seating surfaces for dust, rust, or machining debris before assembly.

Stabilize the test pressure for 30–60 seconds during 26L valve bench tests.

Record results against defined acceptance criteria used by Mikura International for locomotive applications.

How Does Road Impact Gradually Degrade 26L Wiring Harness and Sensor Integrity?

Road impact gradually degrades the 26L wiring harness in locomotives and marine engines.

Cumulative abrasion fatigue from repeated flexing fractures wire strands at termination points.

Insulation chafing against sharp mounting or chassis edges accelerates conductor exposure.

Vibration loosens connectors over time and weakens the pin-to-socket interface seal.

This loosening increases electrical resistance and causes intermittent 26L control faults.

Moisture then enters through compromised connectors and damaged seals.

Corroded terminals distort voltage and current signals from critical control circuits.

These distortions can generate false sensor readings and nuisance fault indications.

Floating rust particles and debris can also bridge contacts and short adjacent pins.

Physical debris impact can crack sensor housings mounted near running gear.

Cracked bodies allow water and contaminants into the sensing element area.

This contamination alters sensor air gaps and magnetic field strength.

Changed clearances disturb the tone ring signal and pulse train accuracy.

Progressive damage can eventually lead to loss of 26L control reliability.

WABCO 26L Brake Assembly Integration How-To Guide

WABCO 26L Brake Assembly Integration How-To Guide

Integrating the WABCO 26L brake assembly on a locomotive can be intimidating, especially when you’re worried about mis-plumbing, incorrect valve positions, or failing initial brake tests that delay a unit’s return to service.

Clear, step-by-step pneumatic and procedural guidance is essential to avoid rework, fault codes, and unsafe brake performance in yard or road service.

  • Difficulty interpreting the 26L pneumatic control logic on complex locomotive brake schematics
  • Uncertainty about correct reservoir and brake cylinder pressure ranges before installation
  • Risk of installing non-OEM parts that compromise brake timing, tolerances, or regulatory compliance
  • Confusion over proper positions of automatic and independent brake valves during setup
  • Fear of trapping pressure in the system and creating unsafe conditions during integration
  • Limited documentation that ties theory (valve sequencing) to practical shop-floor steps
  • Concern about voiding warranty or failing railway safety inspections
  • Need for a quick pre-integration checklist that technicians can follow under time pressure
Pain PointWhat to Check/DoTarget/Requirement
Unsure if system is safe to work onFully depressurize locomotive brake systemGauge reading: 0 kPa where required
Correct main reservoir pressure rangeVerify main reservoir pressure with calibrated gauges750–850 kPa
Risk of residual brake cylinder pressureConfirm brake cylinder pressure prior to integration0 kPa (no residual pressure)
Incorrect automatic brake valve positionSet automatic brake valve handleRelease position
Incorrect independent brake valve positionPlace independent brake valveExtreme left (full release)
Using non-compliant partsVerify components are genuine Wabtec OEMOEM only for warranty and safety
Incomplete understanding of control logicReview pneumatic diagrams and valve sequencingBefore any physical work

To integrate the WABCO 26L brake assembly on a locomotive, you must first understand its pneumatic control logic, internal tolerances, and valve sequencing before any installation begins.

Start by fully depressurizing the locomotive brake system, verifying main reservoir pressure between 750–850 kPa, and confirming brake cylinder pressure reads zero.

Set the automatic brake valve handle to Release and the independent brake valve to its extreme left position.

Use only Wabtec OEM parts to maintain dimensional accuracy, regulatory compliance, and warranty validity.

Continue through this guide to master every critical step in safe, reliable locomotive brake integration.

Key Takeaways

  • Before integration, vent main reservoir to zero psi, close isolation cocks, chock wheels, and set the locomotive handbrake.
  • Verify main reservoir pressure (750–850 kPa), equalizing reservoir at 500 kPa, brake pipe matching equalizing reservoir, and brake cylinder at zero.
  • Set the automatic brake valve handle to Release and place the independent brake valve handle at the extreme left Release position.
  • The 26-F Control Valve manages competing air flow paths when both independent and automatic brake inputs are simultaneously applied.
  • Use only Wabtec OEM parts and consult WABCO Maintenance Manual MM-0112 (pages 38 and 44) for diagnostics and assembly instructions.

What Does the WABCO 26L Brake Valve Actually Do?

controls brake pipe pressure

The WABCO 26L brake valve controls brake pipe pressure to activate control valves across every car and locomotive in the train consist. It regulates air distribution to deliver consistent braking force throughout the entire consist while modulating pressure to prevent wheel lockup during application phases.

You’ll rely on this valve to initiate service braking for controlled stops and trigger emergency sequences through rapid brake pipe venting when critical events demand immediate halts. Brake mode diagnostics become essential here — the valve maintains distinct air pathways for service versus emergency operations, ensuring each mode responds precisely to your inputs.

Operator feedback integration drives the valve’s pressure adjustment capability, allowing you to modulate system pressure within a defined range to match speed control commands. On steep descending grades, it maintains constant brake pressure automatically. This precise control architecture keeps stopping distances optimal while reducing ambiguity between braking modes during active operations. Wabtec engineers this valve as part of a broader commitment to delivering rail and industrial solutions that improve safety, efficiency, and productivity across demanding operational environments.

Unit Bodies, Cylinders, and Clevis Parts Inside the 26L

cast iron valve body assembly

Cast iron forms the structural backbone of the 26L’s main valve body, machined to precise internal tolerances that regulate airflow between its separated automatic and independent brake chambers. Cast ironography durability defines this assembly’s longevity, as the hardened body outlasts internal sealing components by a factor of ten under standard operational conditions.

Inside the cylinders, pistons travel across honed bores, driven by pressure differentials that apply or release train brakes. Your piston sealants selection directly impacts system performance—synthetic rubber seals maintain airtight integrity while resisting degradation from compressed air contaminants. Spring-loaded mechanisms return valves to neutral when you release the handle.

Clevis assemblies bridge your external operating levers to internal valve stems through hardened steel pin connections. You’ll adjust clevis links to calibrate valve timing precisely. Retaining clips secure each pin, preventing disassembly during operation, while lubrication at clevis joints prevents seizing under repetitive cycling. The automatic brake valve controls train brakes through a six-position quadrant, meaning your clevis and lever geometry must accommodate the full range of handle travel across all defined stopping zones.

How to Prepare Your Locomotive for 26L Integration

depressurize isolate inspect secure

Before you begin installing the 26L brake valve, you’ll need to depressurize and isolate the locomotive’s entire pneumatic system. Vent the main reservoir completely to zero psi, then close all isolation cocks on the brake pipe and equalizing reservoir lines. Chock the wheels and set the hand brakes to maintain unit stability throughout the procedure. Make certain adequate locomotive ventilation before venting, as crew safety depends on preventing pressure-related hazards in confined spaces.

Next, inspect the existing mounting bolts for corrosion or thread stripping before removal. Cap all control air supply lines immediately after disconnection to prevent contamination. Clean the brake stand mounting flange of old gasket material and oil residue, then verify the bolt hole pattern against the 26L base dimensions. Use a leveling instrument to confirm the mounting pad is within tolerance, and replace any cracked or compressed vibration isolation mounts before proceeding.

How the 26L Works Alongside the Independent Brake Valve

independent and automatic brake controls

When you operate the 26L alongside the independent brake valve, you’re managing two distinct pressure control circuits that must coordinate without cross-interference. The independent valve transmits pneumatic signals directly to the locomotive’s brake cylinders, bypassing the brake pipe entirely, while the 26L’s automatic section governs brake pipe pressure across the full consist. You’ll need to understand how these pneumatic signal paths interact to maintain precise, conflict-free braking control during both independent and automatic applications.

Coordinated Pressure Control

The 26L system’s coordinated pressure control relies on the Independent Brake Valve operating alongside the automatic brake system to give you direct, isolated control over locomotive brake cylinders without disturbing train brake pipe pressure. When you apply both valves simultaneously, the 26-F Control Valve manages competing air flow paths, producing a combined cylinder pressure that reflects both inputs without conflict.

You can hold a specific automatic brake reduction while adding independent pressure for grade holding or enhanced stopping force. The dynamic brake interlock further prevents wheel slide by automatically reducing air brake pressure when dynamic braking engages. Once you release the independent valve, locomotive cylinder pressure returns precisely to the level your automatic brake setting dictates, restoring clean, predictable brake response across the consist.

Pneumatic Signal Transmission

FunctionSignal Behavior
Independent ReleaseVents engine brake cylinder pressure only
Independent ApplyDirects main reservoir air to locomotive cylinders
Bailing ActiveExhausts local cylinder pressure; train line integrity maintained

During airflow diagnostics, you’ll verify that each pathway operates without bleed-over. The equalizing reservoir retains pressure during bailing, keeping train brakes engaged while locomotive brakes release independently. The brake pipe maintaining feature prevents any unintended progressive increase in braking effort caused by reasonable brake pipe leakage during an application.

Independent Valve Integration

Building on how pneumatic signals route through the system, you’ll now need to understand how the Independent Brake Valve operates alongside the 26L’s automatic section as two distinct but coordinated control paths. The Independent Brake Valve applies force exclusively to locomotive brake cylinders, enabling locomotive isolation from train brake circuit responses.

This separation lets you hold constant cylinder pressure during grade descents without triggering control valves throughout the consist. Independent calibration guarantees your cylinder targets reach approximately 72 psi at full application without interfering with automatic brake pipe pressure. The 26L’s automatic section simultaneously manages brake pipe regulation across every car. You must verify these two paths remain pneumatically isolated; diaphragm compromise in the relay valve allows unwanted crossflow between independent and automatic circuits, degrading precise modulated control.

How to Install the WABCO 26L Brake Valve: Step-by-Step

wabco 26l brake installation

Before mounting the WABCO 26L brake valve, you’ll need to confirm that your system meets all baseline pressure requirements. Verify main reservoir pressure reads between 750 and 850 kPA. Confirm the equalising reservoir gauge shows 500 kPA, and the brake pipe pressure gauge matches that reading. Brake cylinder pressure must indicate zero with the warning light off. Check that brake pipe flowmeter needles sit close together, confirming no active leaks.

Once pressure checks pass, apply the locomotive handbrake before proceeding. Position your mounting brackets correctly to guarantee component alignment during installation. Perform valve lubrication on all moving contact points before seating the assembly. Verify electrical grounding connections meet specification before energising any controls. Set the automatic brake valve handle to Release, place the independent brake valve handle at the extreme left Release position, then insert the reverser key into the direction slot. If the locomotive fails required tests, it must not enter service until all defects have been reported to and rectified by maintenance staff.

Hand Brake Adjustment Specs for the 26L Assembly

hand brake specs absent

Although the WABCO 26L assembly integrates multiple braking subsystems, it doesn’t include dedicated hand brake adjustment specifications within its core documentation. Hand brake mechanisms and manual calibration procedures are treated as separate components, requiring you to consult manufacturer-specific manuals outside the 26-L system scope.

For reference, related heavy-duty brake specifications provide a useful baseline:

ComponentSpecificationApplication
Slack Adjuster6-inch26,000-lb rated systems
Brake Chamber30/30 long strokeHeavy load configurations
Cast Drum120-lb minimum26,000-lb brake demands

When verifying parking torque compliance, cross-reference Hendrickson technical bulletin L1097 alongside your vehicle’s OEM manual. Since Instruction Pamphlet No. 74 omits parking brake metrics entirely, you’ll need supplementary documentation to complete any manual calibration process accurately. Always block wheels before beginning any adjustment work. The WABCO Maintenance Manual MM-0112 covers diagnostics and component replacement across sections beginning on pages 38 and 44 respectively, offering broader system context that may inform adjacent brake assembly procedures.

26L Installation Errors and How to Fix Them

check valves wiring seating

When integrating the 26L assembly, you’ll encounter installation errors that typically fall into three categories: improper component seating, incorrect air line routing, and mismatched electrical connections. You can diagnose pressure failures by checking for voltage supply within the 9.0–16.0 volt operating range, verifying valve resistance values, and confirming that all connectors are fully seated before cycling the system. Once you’ve identified the fault source, correct it by following torque specifications, clearing residual blink codes from ECU memory, and re-testing under controlled conditions to confirm the system’s restored integrity. Always release all air pressure before disconnecting any components, as pressurized air can cause serious personal injury during the correction process.

Common Installation Mistakes

Even experienced technicians make critical errors during WABCO 26L brake assembly installation, and understanding these failure points is essential to preventing costly rework and component damage. Mistakes often stem from improper sealant selection, skipped verification steps, and improper bedding procedures that compromise system integrity from the start. Always reference the latest assembly and maintenance instructions, as new versions are available through WABCO’s INFORM system at www.wabco-auto.com.

Watch for these four critical mistakes:

  1. Using standard grease instead of WABCO-approved high-temperature synthetic lubricant, causing slide pin seizure.
  2. Installing brake pads without verifying correct orientation, producing uneven wear and reduced braking efficiency.
  3. Cross-threading air line fittings, creating pressure leaks that compromise system integrity.
  4. Skipping pad and disc bedding, reducing initial braking performance and causing surface glazing.

You’ll avoid costly failures by addressing each mistake methodically before road testing begins.

Diagnosing Pressure Failures

Pressure failures after a WABCO 26L installation often trace back to electrical and pneumatic faults that are straightforward to isolate once you know where to look. Start with voltage diagnostics: confirm your brake pressure sensors receive 8.0 to 16.0 volts and that ECU supply stays within 9.0 to 16.0 volts. Low vehicle voltage triggers false pressure fault codes, so don’t overlook it.

Next, verify sensor continuity between the signal pin and both ground and power sources. On the pneumatic side, inspect M16x1.5 threaded connections on the foot brake valve for leaks and confirm air lines to the 26C assembly aren’t kinked. Open or shorted ABS valve ground connections cause immediate pressure faults, so test each diagonal before clearing codes from ECU memory. Sensors are recognized as essential components for braking system performance and vehicle safety monitoring, making accurate diagnostics critical to restoring proper pressure function.

Corrective Adjustment Procedures

Isolating a pressure fault gets you halfway there-fixing the root cause at the mechanical, electrical, or pneumatic level is the other half. Apply corrections systematically:

  1. Torque carrier bolts to specification-incorrect adjustment torque distorts brake assembly geometry and misaligns guide pins.
  2. Verify pad centering by confirming caliper orientation; improper positioning causes uneven wear and restricted lateral movement.
  3. Inspect pneumatic lines for crossed routing between front and rear valve packages, leaking fittings, and missing gaiters that admit moisture.
  4. Test electrical integrity by checking ABS valve ground connections on both diagonals, measuring Active Brake Valve resistance (7.0–14.0 ohms), and confirming ECU connector condition.

Correct each fault before clearing codes-unresolved issues mask active errors during post-installation diagnostics.

Why Only Wabtec OEM Parts Are Approved for 26L Repairs

genuine wabtec 26l components

When maintaining the WABCO 26L brake assembly, you’ll find that only Wabtec OEM parts carry approval for repairs — and that distinction isn’t arbitrary. Genuine components exit the supply chain with verified parts authentication, confirming each unit passed WABCO’s internal quality control processes before installation.

Non-genuine alternatives frequently exhibit dimensional discrepancies that compromise fitment with service valves, emergency valves, and control chambers. Those tolerances aren’t negotiable – the 26L’s modular design demands exact geometry to prevent leaks, pressure loss, or inoperative brakes during emergency applications.

Beyond compatibility, using non-approved parts voids warranty coverage and shifts liability directly to the operator following brake failure incidents. Regulators mandate validated components precisely because aftermarket substitutes routinely fail safety audits.

Every genuine Wabtec part also undergoes end-of-line functionality testing, ensuring operational readiness immediately upon installation and maintaining the braking performance integrity the 26L system requires. Operators also benefit from access to a worldwide customer service network of thousands of authorized dealers and workshops, providing support throughout the service life of the brake assembly.

Frequently Asked Questions

Can the 26L Integrate With Electronic Trailer Brake Control Modules?

Maintenance costs drop 75% with modern systems, so you can’t afford signal compatibility gaps. You cannot directly integrate the 26L with electronic trailer brake control modules. The 26L generates pneumatic pressure signals, not digital outputs, creating critical control latency issues that EBS modulators can’t process. You’ll need intermediate conversion hardware or a CCB-26® upgrade to translate pneumatic signals into ISO 11992-compliant digital communication your electronic trailer brake system requires.

You’ll find several pneumatic valves compatible with the 26L system. You can integrate relay valves to amplify brake cylinder pressure signals across longer train consists. Proportioning valves help you regulate pressure distribution between axles for balanced braking performance. Additionally, you’re able to assemble independent brake valves, emergency brake valves, and pneumatic control modules alongside the 26L, creating a cohesive, modular braking architecture that meets stringent operational standards.

How Does the Smartboard Interface Display 26L Brake Status and Errors?

The SmartBoard interface displays 26L brake status through display icons and status LEDs that update in real time as conditions change. You’ll navigate to the Diagnostic Memory menu to review diagnostic logs containing stored error codes ranging from 001 to 246. Codes like 007 identify relay valve solenoid faults, while 075 flags wear sensor failures. You can scroll chronologically through saved fault messages using the “Next” and “Previous” navigation buttons.

Can the 26L Be Used With Desktop-Mounted 30A-CDW Brake Valve Configurations?

You can’t directly replace the 26L’s automatic brake function with the 30A-CDW due to fundamental valve mounting differences. The 30A-CDW’s desktop compatibility suits a consolidated surface layout, while the 26L requires a vertical quadrant stand. You’d typically integrate the 30A-CDW alongside an Independent Brake Valve rather than substituting it. Both systems share brake pipe pressure principles, but their physical configurations and operational mechanics remain distinctly incompatible for direct replacement.

How Does the Emergency Brake Valve Interact With 26L Brake Pipe Venting?

When everything’s at stake, the emergency brake valve triggers immediate emergency venting, rapidly depleting the 26L brake pipe to near-atmospheric pressure. You’ll see the pressure wave propagate instantly through the pipe, commanding maximum braking force across all control valves. The system’s architecture prevents pipe backflow, ensuring unrestricted, unmodulated airflow evacuation. Service functions are completely bypassed, synchronizing locomotive and car brake applications simultaneously for the shortest possible stopping distance.

3 Tips for EMD Locomotive Generator Coupling Bushing Kits

3 Tips for EMD Locomotive Generator Coupling Bushing Kits

When your EMD generator coupling bushings are failing, you’ll notice rhythmic knocking, elevated drivetrain vibration, and erratic voltage output. Before purchasing a replacement kit, verify the bushing bore diameter, outer diameter, and elastomer durometer rating against your specific locomotive’s OEM specs. During installation, use a soft mandrel to press the bushing evenly and check seating depth with a dial indicator. Keep exploring to sharpen your bushing selection and installation process.

Key Takeaways

  • Verify bushing bore diameter, outer diameter, and length match OEM specifications for your specific EMD locomotive model before purchasing.
  • Match the bushing kit’s dynamic load capacity to your generator’s continuous torque output to prevent premature fatigue failure.
  • Use soft mandrels to evenly distribute pressing force and apply light assembly lubricant to the outer diameter during installation.
  • Check seating depth with a dial indicator after installation to confirm proper alignment between the bushing bore and coupling housing.
  • Select kits rated for your duty cycle, as mismatched load ratings between light switching and heavy mainline service accelerate wear.

How to Tell When Your EMD Generator Bushings Have Failed

cracked noisy unstable coupling bushings

Worn or failed EMD generator coupling bushings typically show up through a distinct set of symptoms that you can identify through visual inspection, sound analysis, and performance monitoring. Start by checking for visual wear on the bushing surfaces — look for cracking, deformation, or material loss around the coupling interface. These indicators confirm degradation that’s already affecting mechanical integrity.

Next, monitor for noise increase during operation. A failing bushing transmits abnormal vibration through the drivetrain, producing rhythmic knocking or irregular thumping sounds that intensify under load. Don’t dismiss subtle acoustic changes; they’re early failure warnings you can’t afford to ignore.

You should also track generator output consistency. Coupling bushing failure introduces rotational instability, which disrupts power transfer and causes voltage fluctuation. If you’re seeing erratic electrical output alongside physical wear signs and elevated noise levels, replace the bushings immediately before secondary drivetrain damage occurs.

Choose EMD Generator Bushing Kits by Compatibility and Load Rating

dimensional compatibility and load rating

Before selecting an EMD generator bushing kit, you’ll need to confirm two non-negotiable criteria: dimensional compatibility with your specific locomotive model and a load rating that matches your drivetrain’s torque demands.

Selecting an EMD generator bushing kit starts with two non-negotiables: dimensional compatibility and a load rating matched to your torque demands.

Cross-reference these parameters before purchasing:

  • Model compatibility: Verify bushing bore diameter, outer diameter, and length against your locomotive’s OEM specifications
  • Load rating: Match the bushing’s dynamic load capacity to your generator’s continuous torque output
  • Material grade: Confirm the elastomer durometer rating suits your operational temperature range
  • Interference fit tolerance: Validate the press-fit specification against your coupling hub’s machined bore
  • Service cycle alignment: Select kits rated for your locomotive’s duty cycle, whether light switching or heavy mainline operations

Mismatched load ratings accelerate fatigue failure, while incorrect model compatibility creates misalignment that transfers harmful stress to generator bearings. Always pull your locomotive’s maintenance manual and confirm specifications before finalizing your kit selection.

Install EMD Coupling Bushings Without Damaging the Generator

protect bushings align press gently

Correct installation technique protects both the bushing and generator from damage that’s difficult and expensive to reverse. Before pressing any bushing into position, verify proper alignment between the bushing bore and the generator coupling housing. Misalignment during installation creates uneven stress that cracks the housing or distorts the bushing wall.

Always use soft mandrels when pressing bushings into place. Steel-on-steel contact concentrates force unevenly and gouges seating surfaces, compromising the interference fit you need for reliable power transfer. Soft mandrels distribute pressing force evenly across the bushing flange, preventing deformation.

Apply a light film of assembly lubricant to the outer diameter before pressing. Check seating depth with a dial indicator after installation—an improperly seated bushing shifts under load and accelerates wear on both the coupling and generator shaft. Never use heat on the generator housing unless the manufacturer explicitly specifies it.

Frequently Asked Questions

How Long Do EMD Locomotive Generator Coupling Bushings Typically Last?

EMD locomotive generator coupling bushings typically last between 500,000 and 1,000,000 miles under normal operating conditions, though service intervals vary based on load cycles and maintenance practices. You’ll need to monitor replacement frequency closely, as heavy-haul applications accelerate wear markedly. You should inspect bushings during every major overhaul, typically every 18–24 months, and replace them when clearances exceed manufacturer tolerances to prevent generator misalignment.

What Materials Are EMD Generator Coupling Bushings Commonly Made From?

You’ll find EMD generator coupling bushings commonly manufactured from bronze alloys or composite polymers. Bronze alloys offer superior thermal conductivity and wear resistance under heavy mechanical loads, making them ideal for high-torque applications. Composite polymers, however, provide excellent vibration dampening and corrosion resistance in moisture-prone environments. When selecting your bushing material, you’ll need to evaluate your locomotive’s operational demands, load cycles, and environmental conditions to determine the most appropriate composition.

Can Worn Bushings Cause Fuel Efficiency Problems in EMD Locomotives?

Yes, worn bushings absolutely tank your fuel efficiency—it’s like running a steam-age machine in a modern fleet. When bushings degrade, you’ll experience misalignment between the engine and generator, forcing the prime mover to work harder. This inefficiency creates reduced power output, meaning your engine compensates by burning more fuel. Additionally, incomplete combustion cycles trigger increased emissions, compounding both your operational costs and environmental compliance concerns.

Are EMD Generator Bushing Kits Covered Under Any Warranty Programs?

It’s not a one-size-fits-all situation — warranty coverage varies by supplier. You’ll typically find that OEM-certified EMD generator bushing kits carry manufacturer-backed warranties, covering defects in materials and workmanship. Additionally, you can secure extended protection through service contracts offered by authorized distributors. Always review contract terms carefully, confirming coverage durations, exclusions, and replacement procedures before committing to guarantee your components remain operationally compliant and protected.

Translate »